
")
.svg) Steven Dam
Steven Dam
How Project Management and MBSE Work Together
Project Management and Model-Based Systems Engineering (MBSE) are closely intertwined disciplines, especially in the context of managing complex...
%20(200%20%C3%97%20100%20px)%20(800%20%C3%97%20400%20px)%20(15).png)
Before we jump into how project management is vital to the success, or unfortunately, the failure of a project, it is important to understand what project management is. Project Management Institute, also known as PMI, defines project management as” the use of specific knowledge, skills, tools, and techniques to deliver something of value to people.”
Although every project is different, serving a unique purpose conducted by unique individuals, the relatively same process is followed for each endeavor. A team of organized, problem-solving subject matter experts comes together to guide the execution of the project. Documents are composed to define the budget, resources, and time constraints demanded by the project and its sponsors. Expectations for how the project will be carried out and the values to be delivered are declared. Risks are identified and mitigated to the best of the team’s ability. This detailed planning may seem tedious, or even excessive, during the early development of the project, but this is the time when the project is at its greatest risk of failure.
Project management, like systems engineering, is a complicated and thorough process that can make or break a project and its resulting value. However, its planning and documentation define the responsibilities of team members and duties of project sponsors; at the end of the project’s chapter, all that planning and documentation defines how successful the project was at meeting its anticipated value, who properly executed their tasks, and whether or not the budget and the schedule were adhered to. Without all these markers, no one would know or have criteria to base success.
As stated in the Project Management Institute’s definition of project management, all the knowledge, skills, and techniques needed for a project are brought together with the implementation of project management. If all these aspects of project management are carried out by people, then what use is a tool?
Project management tools support the people conducting project management. They are the backbone of the entire project management process. Tools allow team members to document work during planning, track the progress of work during execution, and manage the consumption of costs, resources, and time. Like the implementation of project management itself, choosing a project management tool is just as important and can make or break a project.
The addition of a Project Management View in Innoslate completes this systems engineering tool’s digital thread and offers exciting new features to elevate any project. On the cloud, collaborate effectively in real-time with team members to produce project management plans, construct schedules with deadlines, and analyze project costs. The Project Management dashboard supports project managers with managing important deadlines and events and tracking tasks and progress.
This blog is the first in a new series walking through Innoslate’s Project Management View, features, and best practices. Stay tuned for more project management in Innoslate, a data-driven model-based systems engineering tool.
PMI source: https://www.pmi.org/about/learn-about-pmi/what-is-project-management
Before this user guide dives into how to navigate the Project Management View, it is important to understand the schema changes that have been made within Innoslate to support the new view. Updates have been made to the existing Time class including attributes and labels; two sub-classes, Task and Dependency, have been created to support Kanban Boards and Gantt Charts; and lastly, two bilateral relationships have also been added to Innoslate's schema to complete traceability between these new project management features. The updates made to Innoslate’s class schema are discussed here.
‘Kanban Column’ is a new label used on Time entities to distinguish them from other Time entities in the Database as Kanban Columns.
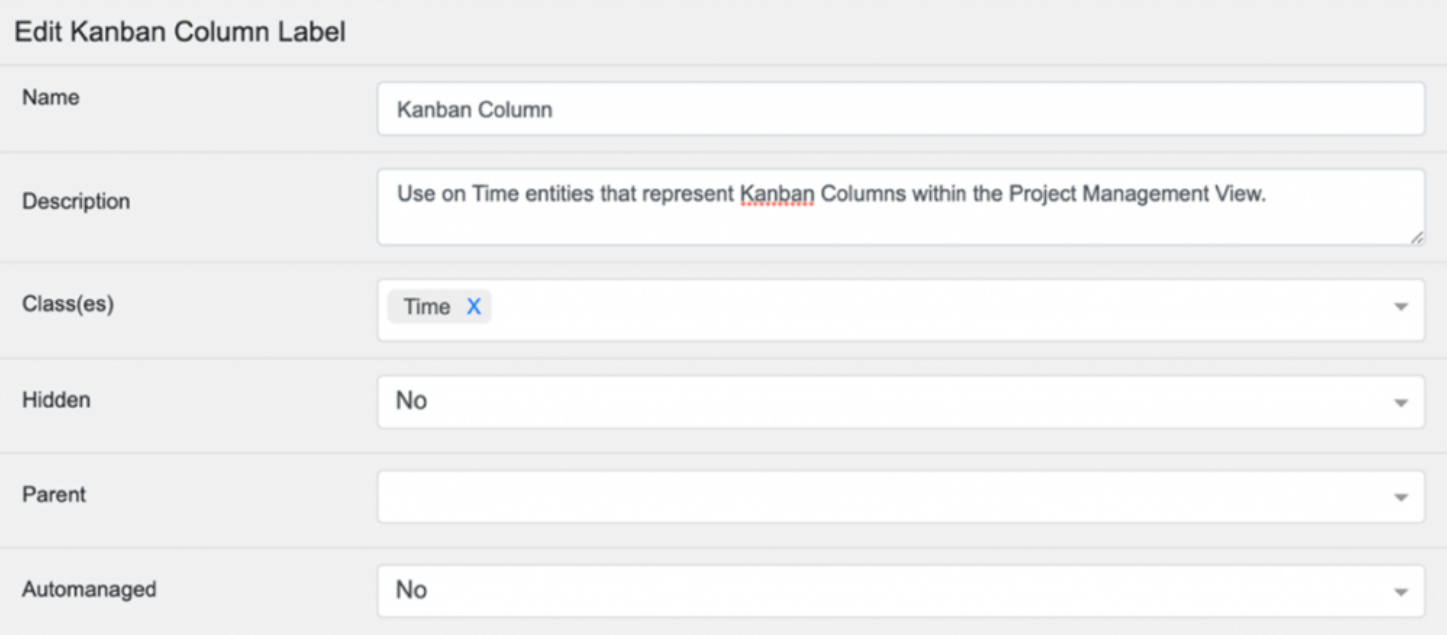
Kanban Column Label Description
Task is a new sub-class of Action. A ‘Task’ entity specifies an Action that must be completed for a particular project. It serves as a "To-Do" action idem for a project or Kanban board.
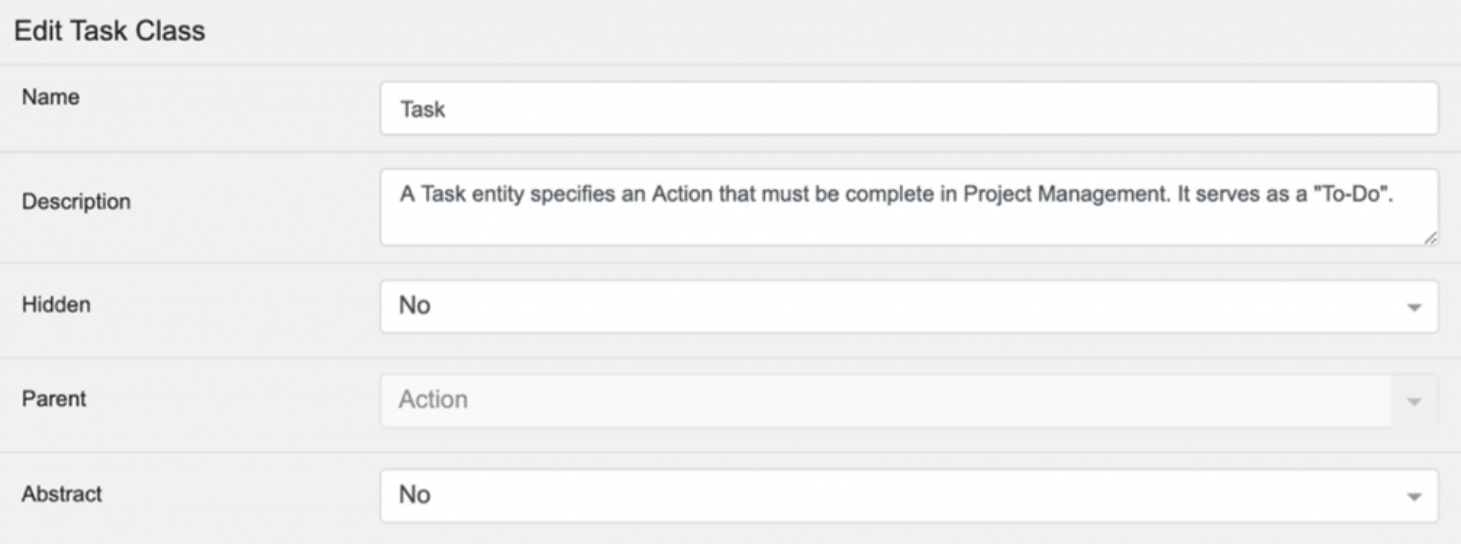
Task Class Description
The Task class inherited all the attributes of its parent class, Action: Duration, Start, and Percent Complete.
Five additional attributes have also been added to the new Task class: Due Date, Estimated Date of Completion, Finish Date, Assignee, and Status. The ‘Due Date’ attribute allows users to specify when a particular Kanban board or Task is due. The ‘Estimated Date of Completion’ attribute allows users to set when the Kanban board is likely to be completed based on the Percent Complete attribute of each Task in the Kanban board. The ‘Finish’ attribute states the actual date the Task or Kanban board was completed. The ‘Assignee’ attribute assigns a user within the project to be responsible for completing the Task, and the ‘Status’ attribute allows users to define the progress of the Task.
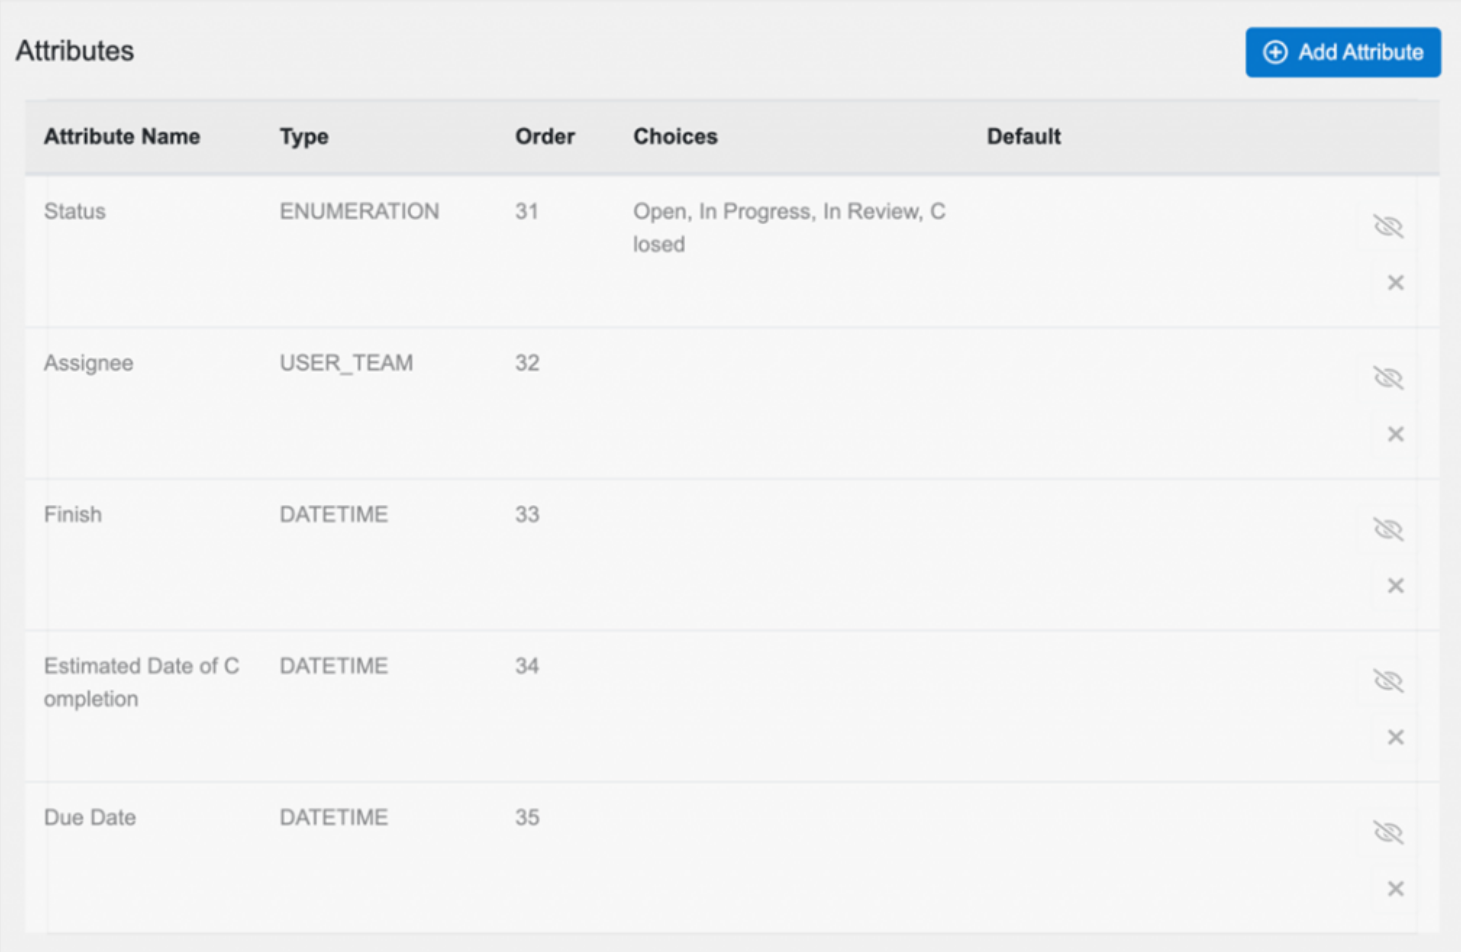
Task Class Attributes
Labels for the Task class are not auto-managed and therefore the Task class does not inherit the labels of its parent class, Action. Instead, Task has two types of labels: Kanban Board and Task priorities. The ‘Kanban Board’ label is used on Task entities to distinguish them from other Task entities in the Database as Kanban boards. A set of Priority labels define the level of importance for the Task or Kanban board as ‘Low Priority,’ ‘Medium Priority,’ and ‘High Priority.’
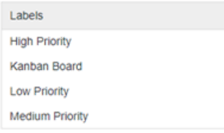
Task Class Labels
Unlike labels, the Task class does inherit the relationships of the Action class. In addition to these inherited relationships, other relationships were also added to the Task class. The decomposes/ decomposed by was added to allow for the creation of sub-tasks, also known as children. This relationship can also be used to relate Action entities with Task entities. A few more relationships were developed to relate Tasks to other entities in the Project Management View. These are discussed later.
Dependency is a new sub-class of Connection. A ‘Dependency’ entity specifies a connection between two Tasks in a Gantt chart. It defines the relationship between a Task that depends on another Task to be able to start or finish.
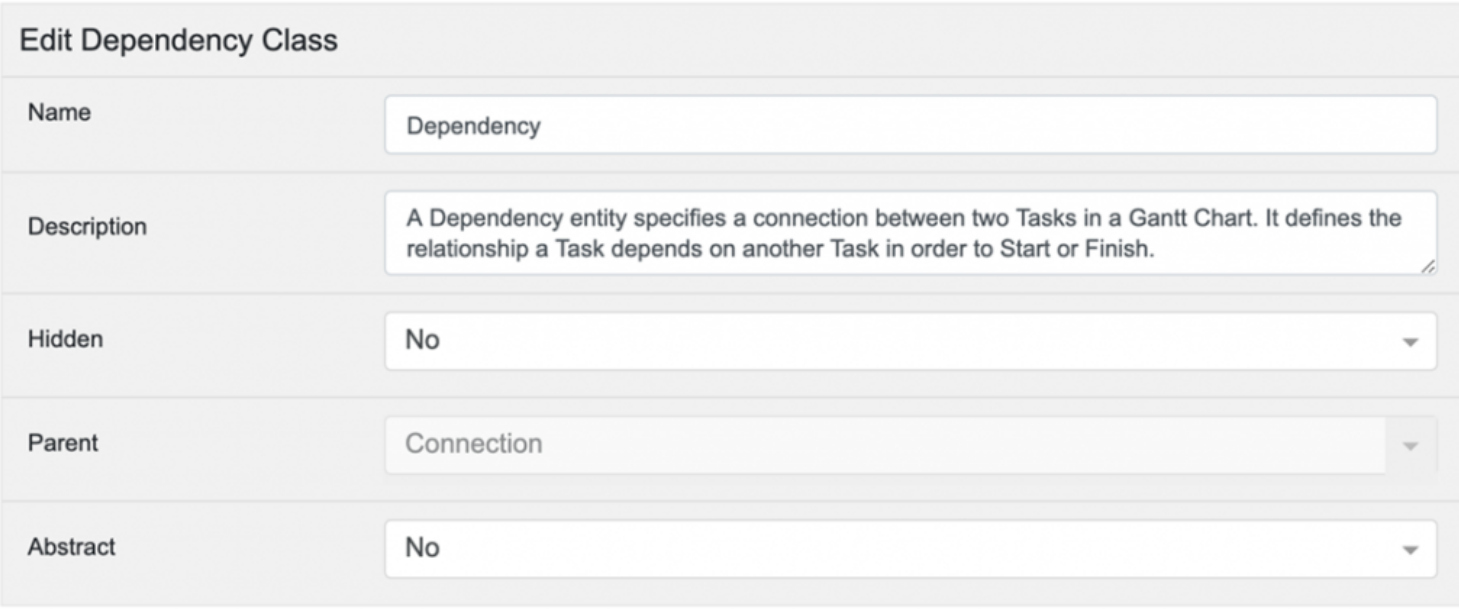
Dependency Class Description
The Dependency class has no additional attributes, and none were inherited from its parent class, Connection, because it also does not have any attributes. However, Dependency does inherit the relationships of the Connection class. The depends on/ has dependent relationships were also added to the Dependency class with some updates that are later.
Before this user guide dives into how to navigate the Project Management View, it is important to understand the schema changes that have been made within Innoslate to support the new view. Updates have been made to the existing Time class including attributes and labels; two sub-classes, Task and Dependency, have been created to support Kanban Boards and Gantt Charts; and lastly, two bilateral relationships have also been added to Innoslate's schema to complete traceability between these new project management features. The updates made to Innoslate’s relationship schema are discussed here.
The bilateral relationships, Tracks/ tracked by, were created to connect a Time entity that represents a Kanban column to a Task entity that represents a Kanban board. These relationships define which Kanban columns are displayed in a Kanban board.
‘Tracks’ identifies the Time entities that are Kanban columns in a Task entity's Kanban board. ‘Tracked by’ identities the Task entity's Kanban board that the Time entity is a Kanban column within.
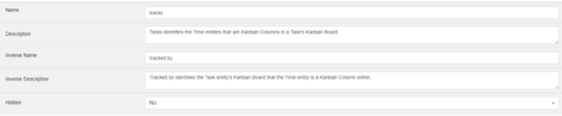
Tracks/ Tracked by Relationship Description
More simply put, a Task entity tracks a Time entity, and a Time entity is tracked by a Task entity. The tracks/ tracked by relationships have no additional attributes.
The bilateral relationships, Schedules/ Scheduled by, were created to connect a Task entity to a Time entity that represents a Kanban column. This relationship defines what Tasks are displayed in each Kanban column.
‘Schedules’ identifies the Task entities that are organized within a Time entity's Kanban column. ‘Scheduled by’ identifies the Time entity's Kanban column that a Task is organized within.
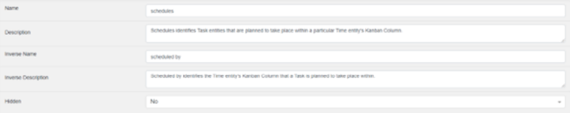
Schedules/ Scheduled by Relationship Description
More simply put, a Time entity schedules a Task entity, and a Task entity is scheduled by a Time entity. The schedules/ scheduled by relationship have no additional attributes.
Innoslate's existing ‘Depends on/ has dependent’ relationships were updated to support Dependency entities in the newly created Gantt chart. A Task entity ‘depends on’ a Dependency entity, and a Dependency entity ‘has dependent’ Task entity.
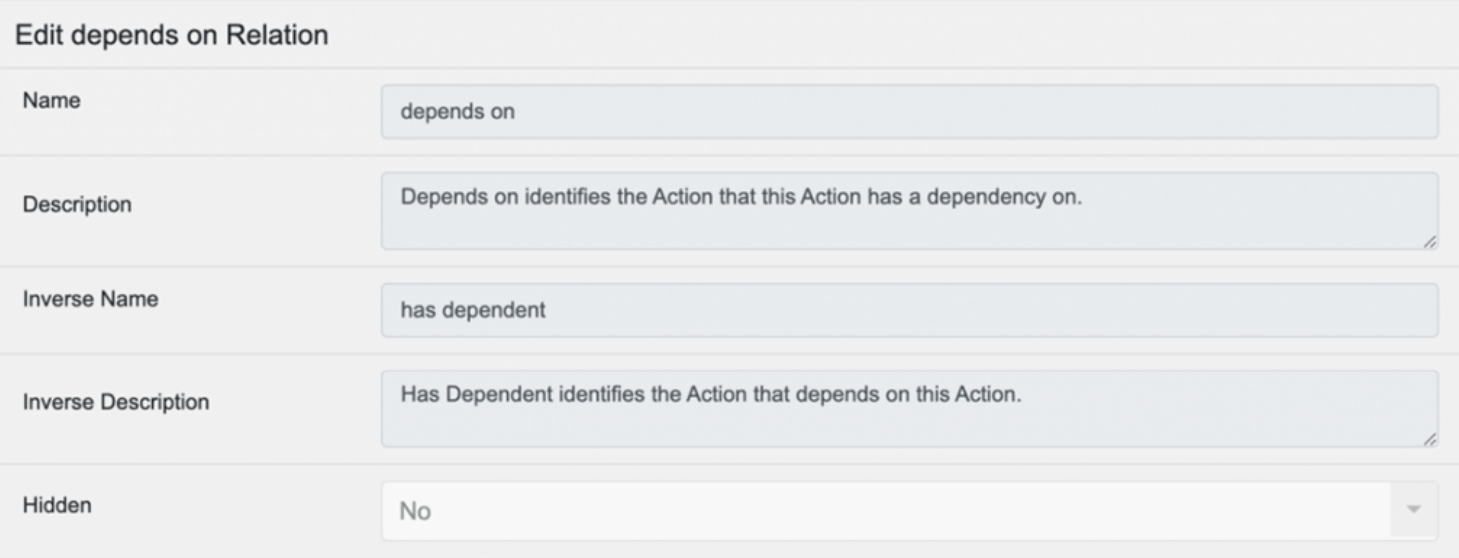
Depends on/ Has dependent Relationship Description
Two attributes were added to these bilateral relationships to define the dependency relationship type and specify directionality in the new Gantt chart type: Origin and Dependency.
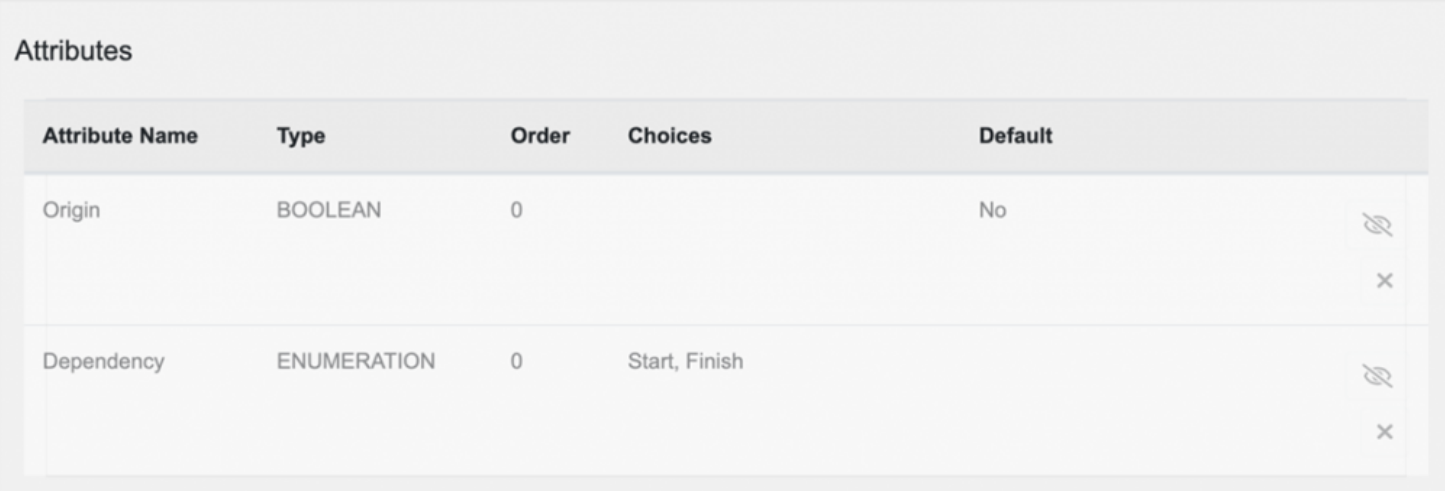
Depends on/ Has dependent Relationship Attributes
The ‘Dependency’ enumeration attribute defines which end of the Task is connected to another Task in a Gantt Chart:
The ‘Origin’ Boolean attribute defines the directionality of the connection:
How to use these relationships and the four types of Origin/ Dependency combinations are discussed later.
The Spider diagram below is a visual summary of the schema updates made to support project management in Innoslate.
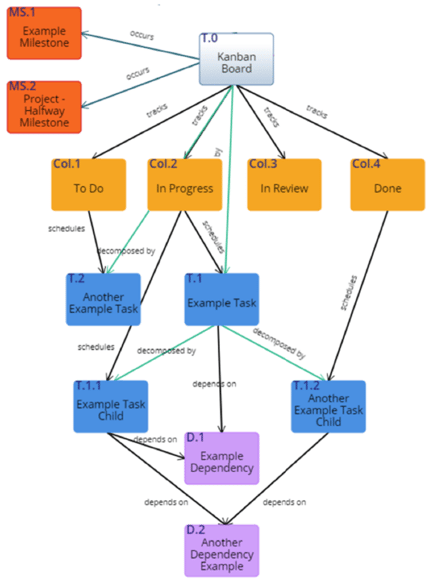
Innoslate’s Project Management Schema
Kanban boards (light blue) are represented in Innoslate as Task entities with a Kanban Board label. columns of a Kanban board (orange) are represented as Time entities with a Kanban Column label. In the above Spider diagram, the entity at the top is a Kanban board, and the Kanban columns are added to the Board using the tracks/ tracked by relationships.
Milestones (red) are represented as Time entities with a Milestone label. They are used in the Timeline diagram and are connected to the Kanban board's Task entity using the occurs/ occurred by relationships.
Tasks (dark blue) decompose the Kanban board's Task entity using the decomposes relationship. Tasks are then organized within the Kanban board according to Kanban column Time entities using the schedules/ scheduled by relationships. Tasks are connected in Gantt charts through Dependency entities (purple) using the depends on/ has dependent relationships.
The new Project Management View can be found in Innoslate using the drop-down ‘Menu’ button in the top left corner of a Project Dashboard.
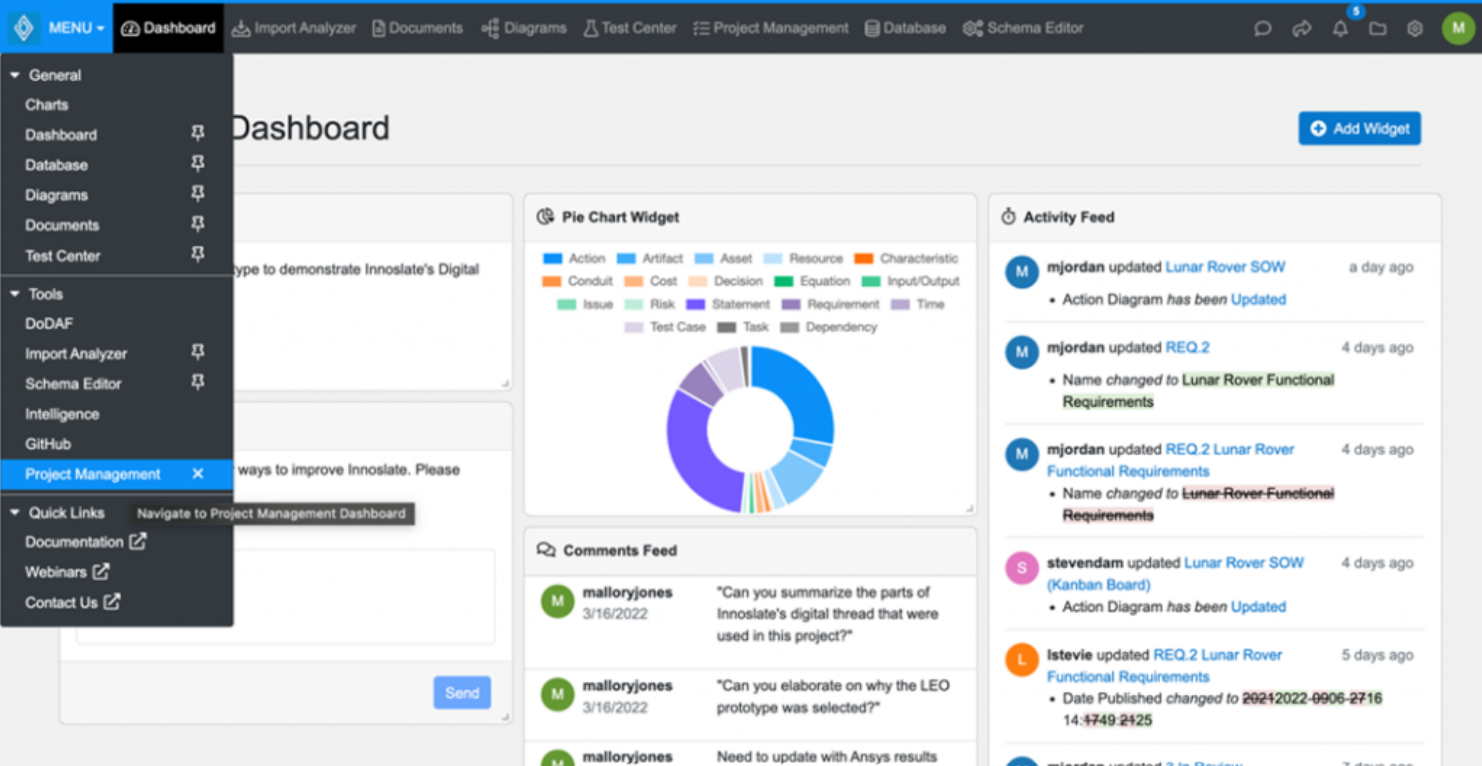
Navigating to Project Management View
Innoslate’s Project Management View has three sub-views: Project Management Dashboard, Kanban Boards View, and Gantt Charts View.
Project Management View
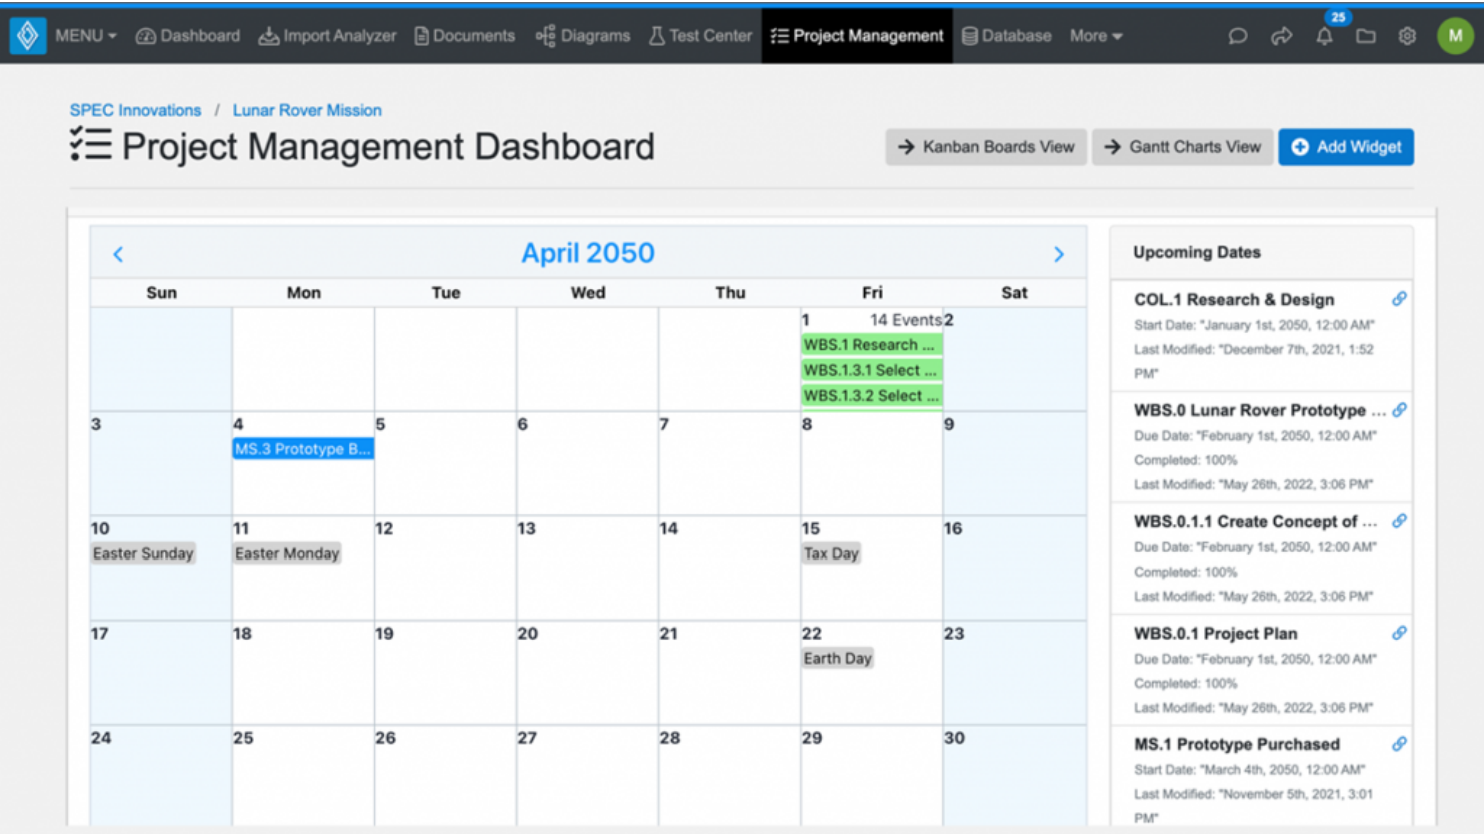
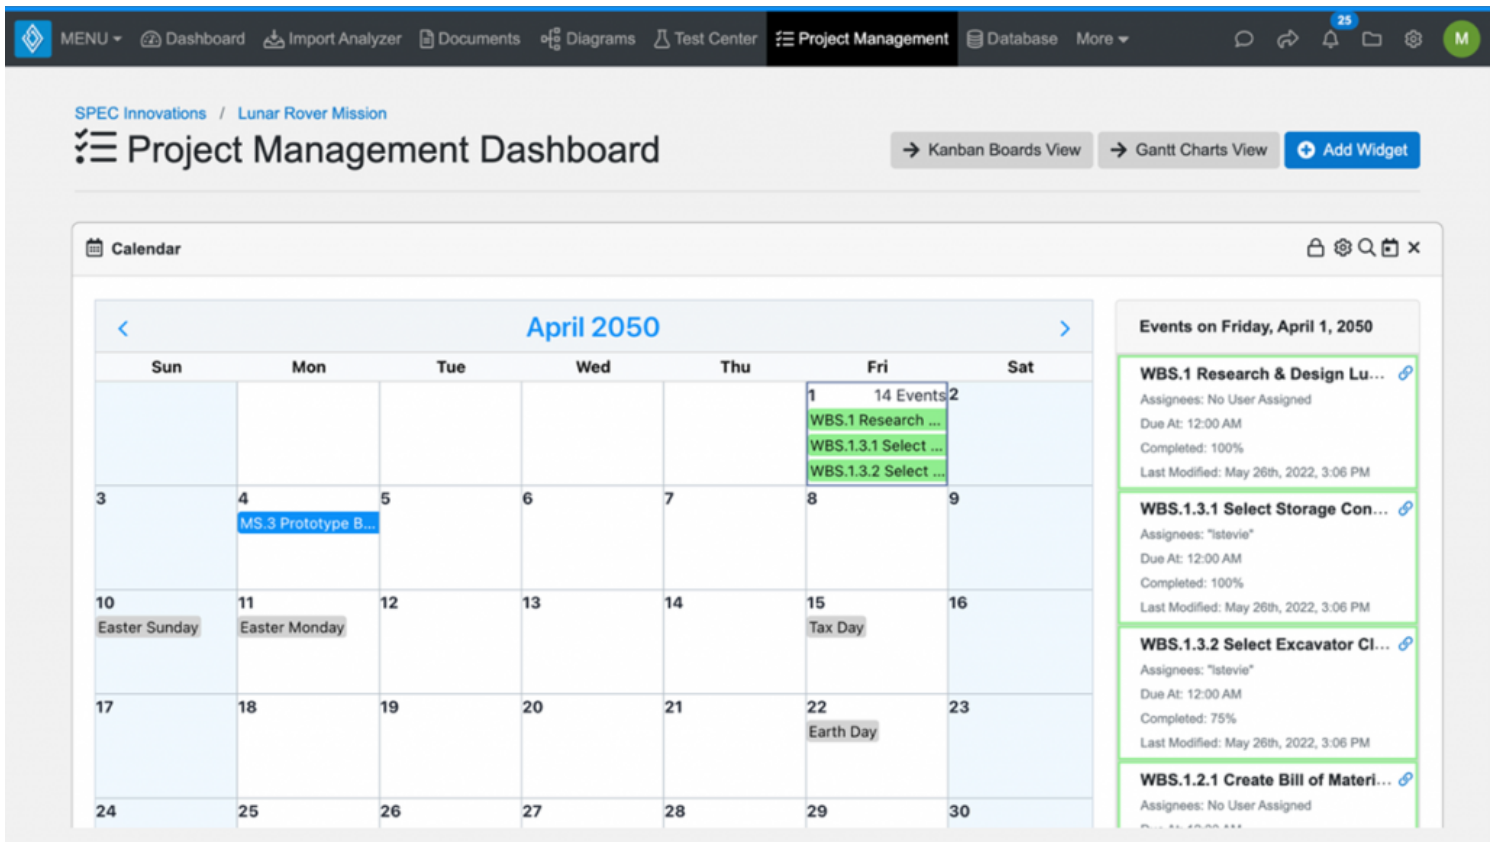
The Project Management Dashboard serves as a centralized location for users to keep track of their upcoming deadlines and manage their project tasks. This new view contains four widgets: Dashboard Calendar, Upcoming Dates, Hierarchy Diagram, and Board Progress.
The Project Management Dashboard serves as a centralized location for users to keep track of their upcoming deadlines and manage their project tasks. This new view contains four widgets: Dashboard Calendar, Upcoming Dates, Hierarchy Diagram, and Board Progress. The Dashboard Calendar and Upcoming Dates widgets are discussed here.
The ‘Project Management Dashboard Calendar’ can be used to view various upcoming start and due dates whether they be for Kanban Boards, Tasks, Milestones, and U.S. holidays.
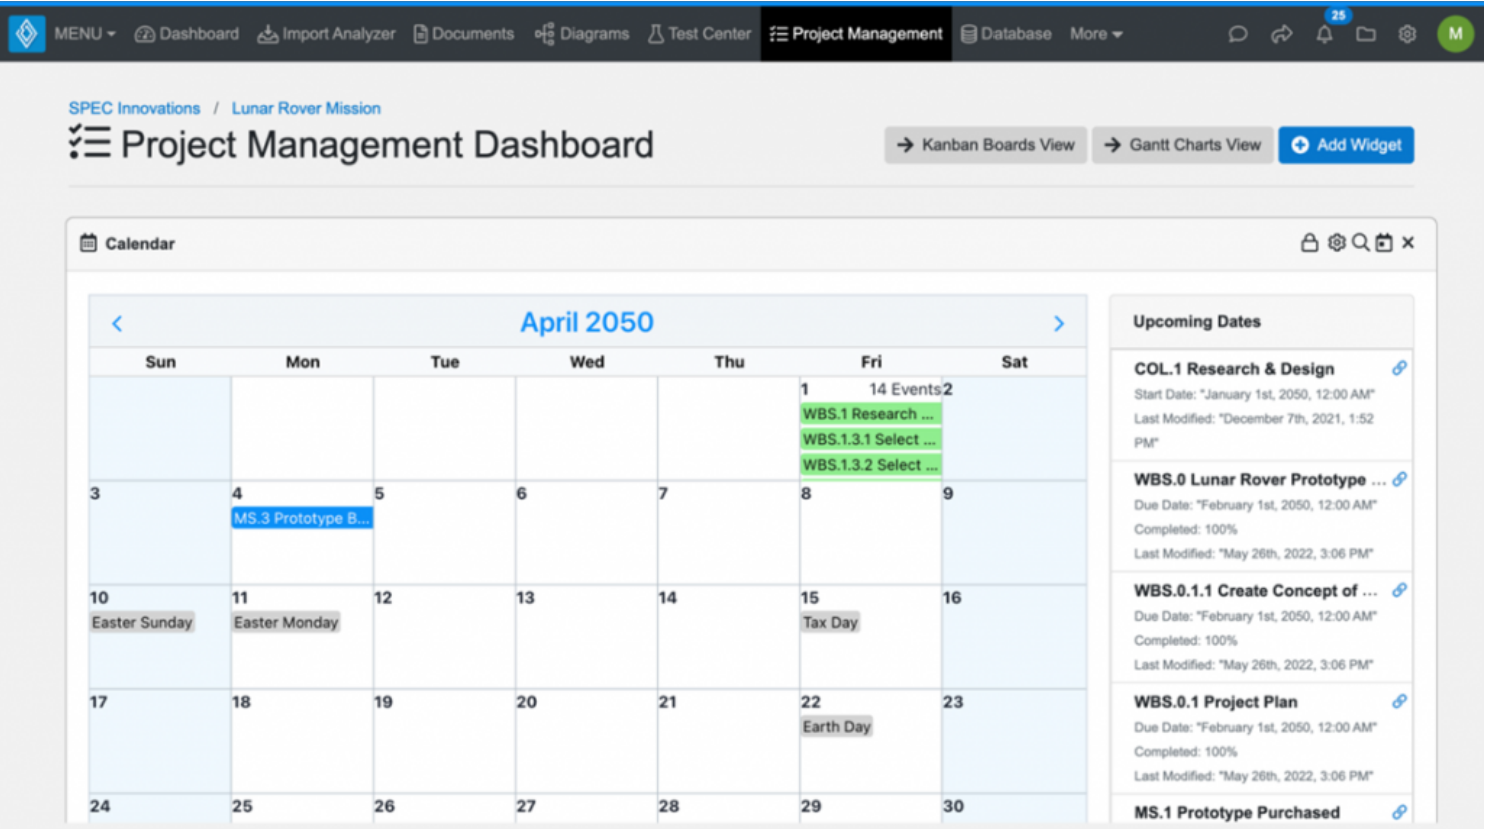
Project Management Dashboard Calendar
Settings, located in the upper right corner of the Dashboard Calendar widget, can be used to determine which entities are displayed in the calendar as well as which colors each entity type is highlighted in the calendar.
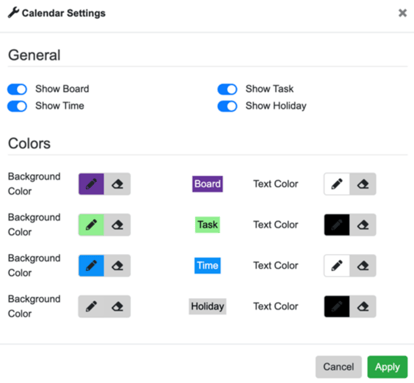
Project Management Dashboard Calendar Settings
Innoslate automatically populates these dates by searching the project's Database for Task entities with Kanban Board labels, Time entities with Kanban Column and Milestone labels, and Task entities.
To quickly locate dates in the Dashboard Calendar, use the hourglass located in the upper right corner of the Dashboard Calendar widget. Search any entity by name to find Kanban boards, Kanban columns, Milestones, and Tasks. The calendar search results will only populate for the entity types that are currently selected in the calendar settings. For example, if Task entity due dates are turned off, then no results will appear in the search for a Task entity due date.
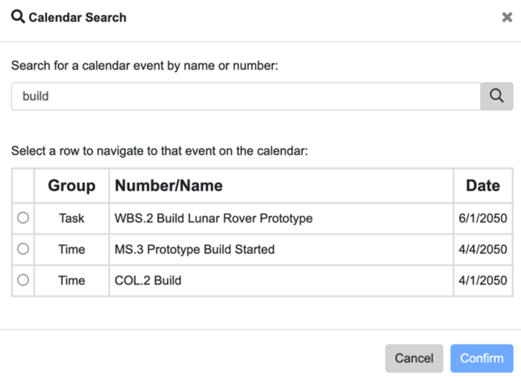
Project Management Dashboard Calendar Search
The Dashboard Calendar can be navigated using the arrows at the top of the widget. The month displayed can be quickly changed by clicking on the current month and selecting a new month. This can also be done to change the calendar’s year displayed. To return to today’s date in the Dashboard Calendar, click the calendar icon in the top right corner of the Project Management Calendar Dashboard Widget.
The ‘Upcoming Dates’ widget displays start and due dates for Kanban Boards, Kanban Columns, Milestones, and Tasks as they appear in the Project Management Dashboard Calendar. These dates are ordered starting with today's current date at the top and ending with the latest, future date at the bottom. Only entities with dates past today will be displayed in the Upcoming Dates widget, those that have already passed will not be displayed.
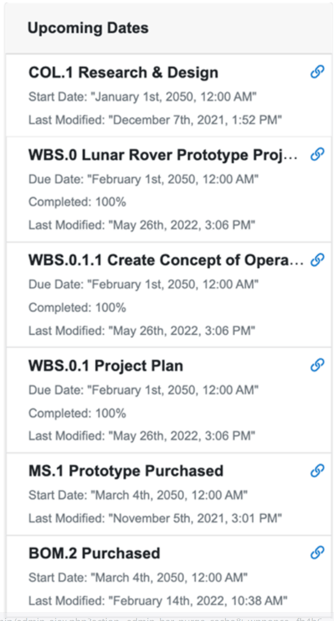
Upcoming Dates Widget
To view the attribute details of a date in the Dashboard Calendar, click on that date directly in the Dashboard Calendar. Innoslate will filter the Upcoming Dates widget to only display those start or due dates. The dates will be highlighted in the same color as they are in the Dashboard Calendar.
Upcoming Dates Widget by Specific Date
Attributes displayed per each entity in the Upcoming Dates widget include Entity Number and Name, Assignees, Start or Due Date, Percent Complete, and the date the entity was last modified. Click on the hyperlink icon next to an entity’s name to navigate to that date’s Entity View.
The Project Management Dashboard serves as a centralized location for users to keep track of their upcoming deadlines and manage their project tasks. This new view contains four widgets: Dashboard Calendar, Upcoming Dates, Hierarchy Diagram, and Board Progress. The Hierarchy Diagram and Board Progress widgets are discussed here.
The ‘Hierarchy Diagram’ widget can be used to view the Work Breakdown Structure (WBS) of a selected Kanban Board.
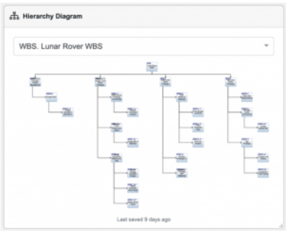
Hierarchy Diagram Widget
To view a hierarchy diagram on the Project Management Dashboard, select a Kanban board from a list of Kanban boards in the current Innoslate project.
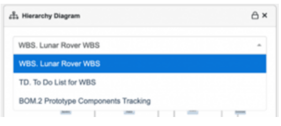
Hierarchy Diagram Selection
However, only the Kanban boards that have opened and saved a hierarchy diagram will populate once selected. If the selected Kanban board has not had a Hierarchy diagram opened and saved from it, then the following error will occur.
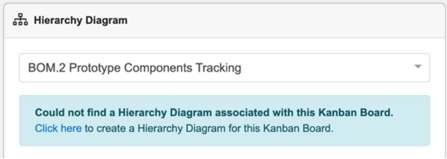
Hierarchy Diagram Missing
To navigate quickly to the selected Hierarchy diagram, click anywhere in the Hierarchy Diagram widget.
The ‘Board Progress’ widget is a bar chart on the Project Management Dashboard. It displays the number of Tasks assigned the scheduled by relationship per each Kanban column of a selected Kanban board.
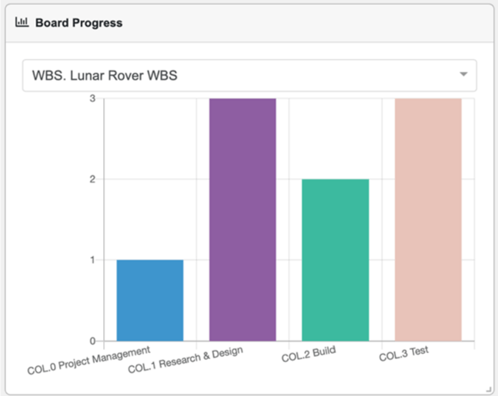
Board Progress Widget
To view this chart on the Project Management Dashboard, select a Kanban board from the list of Kanban boards in the current Innoslate project. The X-axis displays all the Kanban columns from the selected Kanban board. The Y-axis displays the total number of Tasks entities per each Kanban column in the Kanban board.
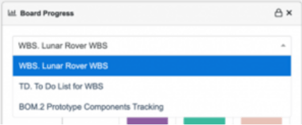
Board Progress Selection
In the previous example above, there are two Tasks in the ‘Build’ Kanban column and three Tasks in the ‘Test’ Kanban column.
‘Kanban Board’ is a new chart type available in Innoslate’s Charts View. Kanban boards are also stored in their sub-view of Innoslate’s Project Management View, ‘Kanban Boards View’. Kanban Boards View can be located by navigating to the view from the main Project Management Dashboard.
Similar to Documents and Diagrams View, Kanban Boards View holds all of the current Innoslate project's Kanban boards in one place. For Kanban boards to populate in this new view, there must be a Kanban Board label on the Task entity representing the Kanban board. Kanban Boards View can be used to add, delete, or rename Kanban boards.
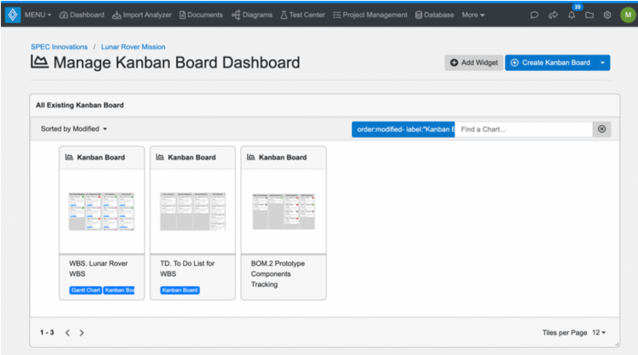
Kanban Boards View
Each panel in the Kanban Boards View is its own Kanban board with unique Kanban columns and Tasks. Search for a Kanban board using ‘Find a Chart’. Sort through the displayed Kanban boards alphabetically, numerically, most recently modified, or most recently created. Rename or delete any Kanban boards directly in the Kanban Boards View.
Kanban boards can be created directly in the Kanban Boards View. Click the ‘Create Kanban Board’ drop-down button to display a prompt for creating a new Kanban board. A template can be used to automatically generate four Kanban columns in the new Kanban board, or a blank Kanban board can be created to produce Kanban columns from scratch.
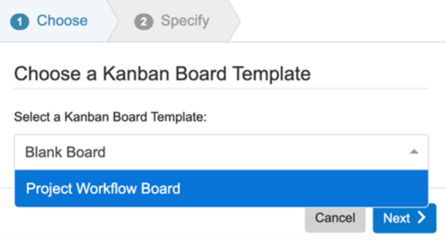
Kanban Board Creation Prompt
By selecting the ‘Project Workflow Board’ template, four new Kanban columns will be automatically generated in the new Kanban board: ‘To Do’, ‘In Progress’, ‘In Review’, and ‘Done’. When the Kanban columns are produced, the Kanban Column label and the tracked by relationship are also assigned to each of the Time entities created.
By selecting a ‘Blank Board’, Kanban columns will not be automatically generated in the new Kanban board. Once the blank Kanban board is created, time entities must be manually added by clicking ‘New Column’.
Next in the new Kanban board prompt, enter a Number, Name, and Description for the Kanban board, similar to Documents and Diagrams. The Kanban Board label will be automatically applied to the Task entity when the Kanban board is created directly in Kanban Boards View.
After creating a new Kanban board or opening a previously created one from the Kanban Boards View, Kanban columns and Tasks are first displayed in the ‘Kanban View’. Each Task to be completed is displayed as a card within the Kanban Board.
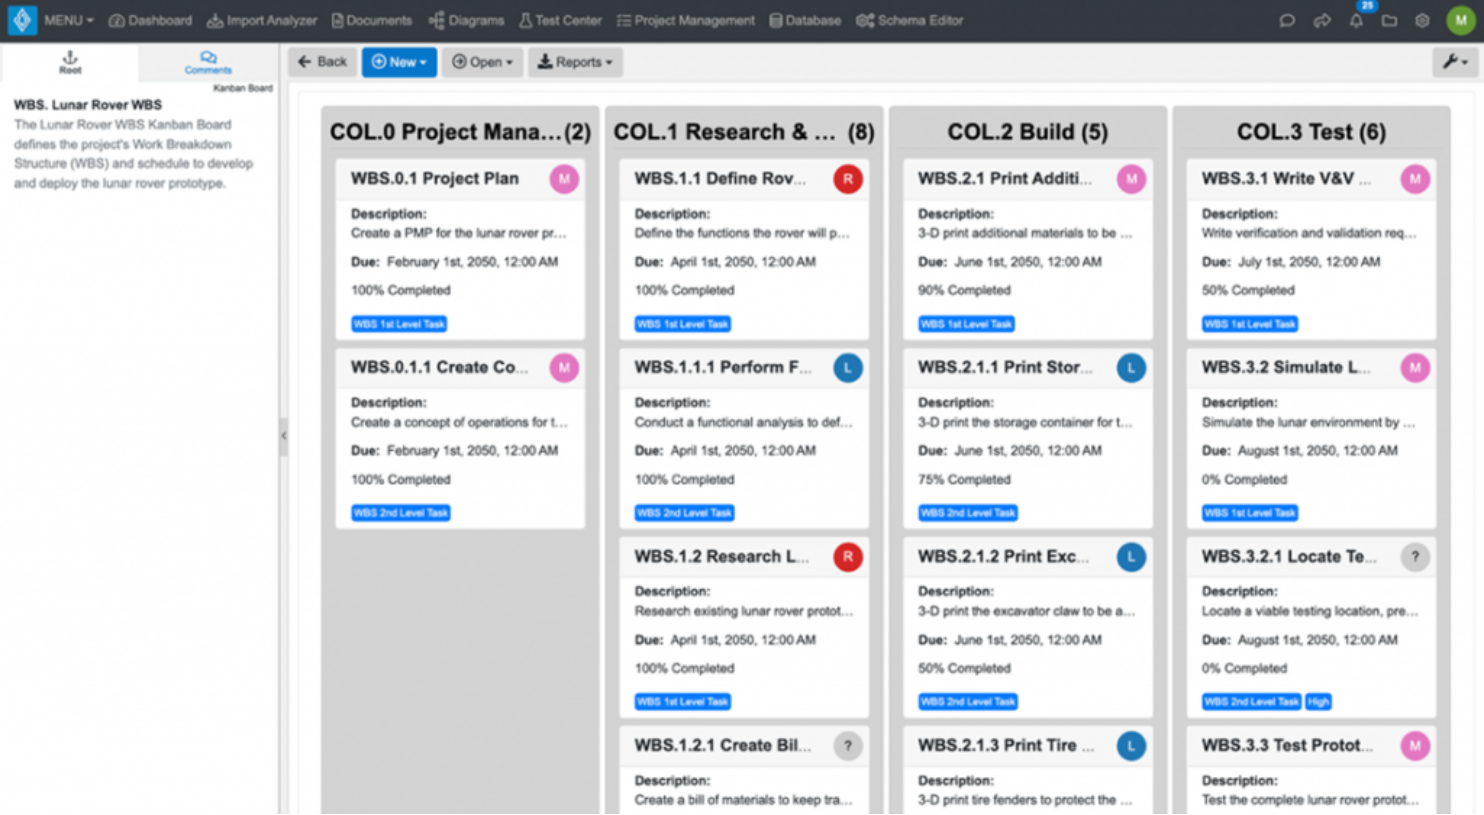
Innoslate’s Kanban Board - Kanban View
Kanban columns are ordered in the Kanban board by their Number attribute in the Time entity. To reorder the Kanban columns, just give each Time entity a new number.
Tasks are organized in each Kanban column using the schedules/ scheduled by relationships, but they can be reassigned by dragging and dropping the Task in any Kanban column in the Kanban board. Innoslate will automatically remove the old Kanban column from the scheduled by relationship and add the new Kanban column in its place.
A ‘Grid View’ is also provided in Innoslate as an alternative way to display Tasks in the Kanban board. In Grid View, Tasks are displayed as rows, and each Task attribute is displayed as a column.
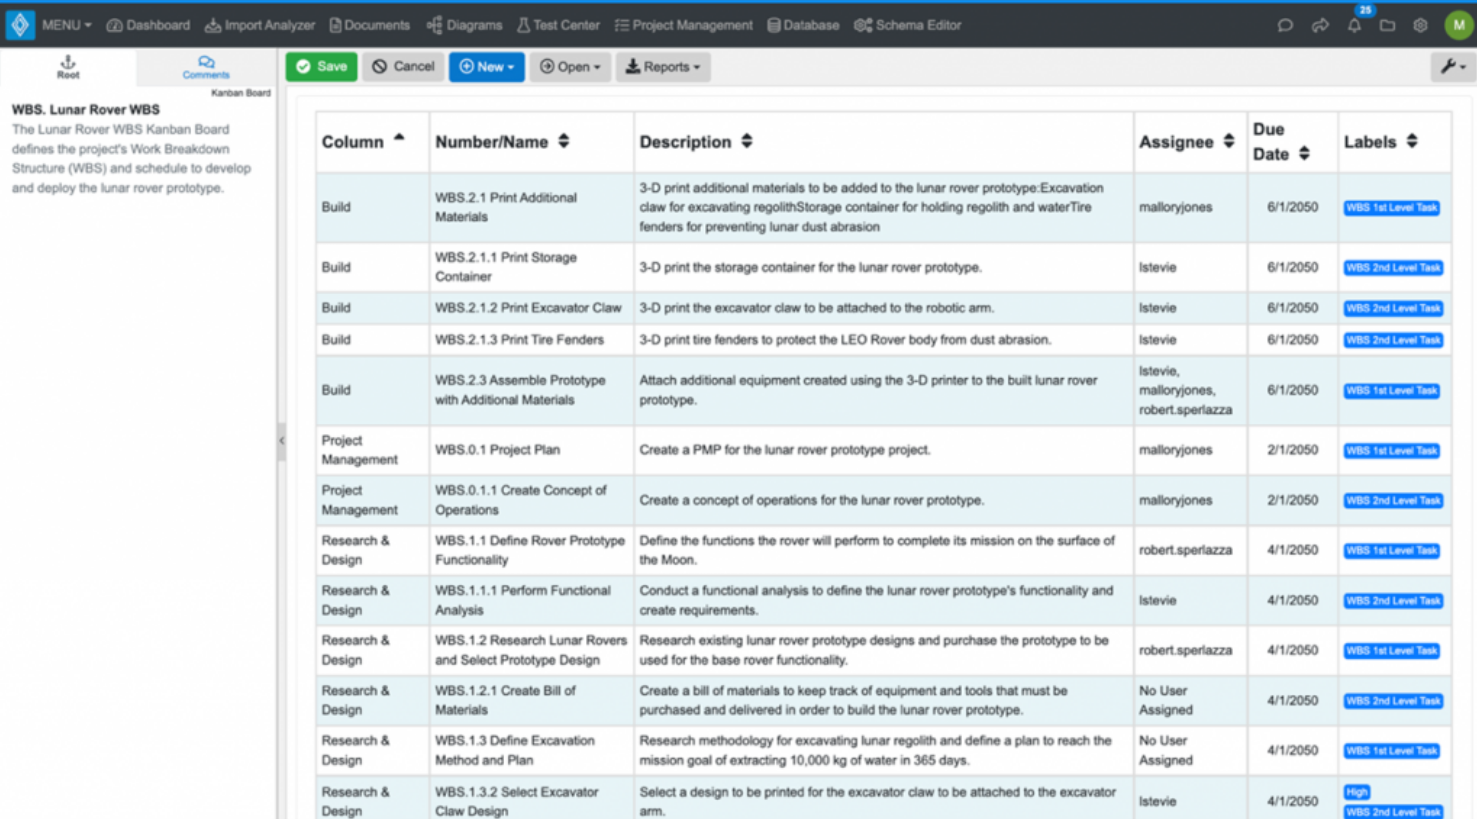
Innoslate’s Kanban Board - Grid View
Grid View can be found in ‘Settings’ in the upper right-hand corner of the Kanban Board. In this same location, the Kanban board’s display can be switched back to Kanban View.
All of the same features of Kanban View are available in Grid View, however, one exception is that Task entities may not be dragged and dropped to change their assigned Kanban columns. The Tasks' scheduled by relationship must be updated manually within its Entity View to change Kanban columns.
Innoslate’s Kanban board features are similar to any other tool’s Kanban boards. These features include:
Kanban board settings are also available in the top right-hand corner of the Kanban board. These Kanban board settings include:
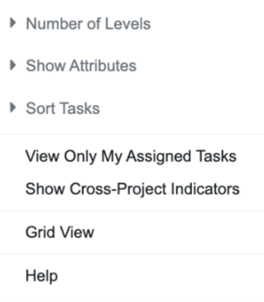
Kanban Board Settings
New Kanban columns and Tasks can be created directly in any Innoslate Kanban board. To create a new entity in a Kanban board, click ‘New’ and then choose to create a new Kanban column or a new Task.
To create a new Kanban column, provide a number, name, and description for the new Time entity. A Kanban Column label will automatically be applied to the Time entity when it is created in a Kanban board.
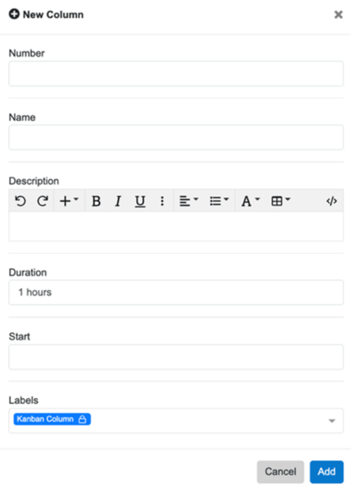
Kanban Column Creation Prompt
To create a new Task, provide a number, name, and description for the new Task entity. A Kanban column must be selected during Task creation to organize the Task in the Kanban board. If a Kanban column is not selected from the drop-down list of Kanban columns in the current Kanban board, then the Task will not be allowed to be saved to the Kanban board. Additional attributes for the Task can also be added during its creation in the Kanban board: Duration, Start Date, Percent Complete, Status, Assignee, Finish Date, Estimated Date of Completion, Due Date, and labels.
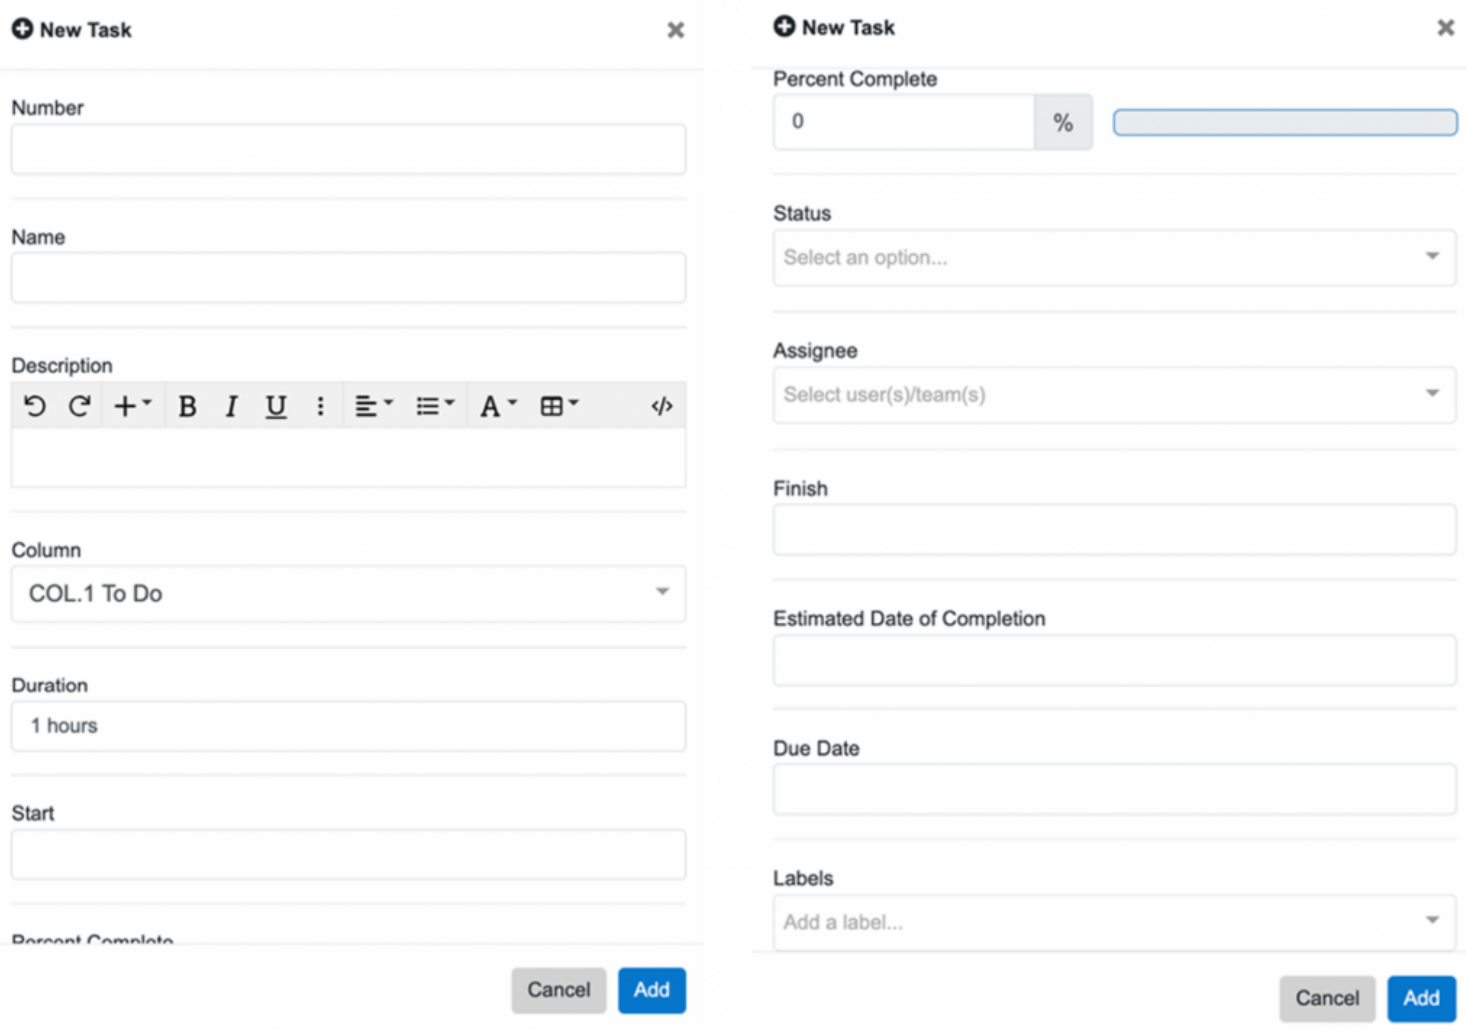
Task Creation Prompt
Task children, or decomposing a Task, can be created in Innoslate Kanban boards using one of two methods:
When child Tasks are created using these methods, they are not automatically assigned a scheduled by relationship to a Kanban column in the designated Kanban board. Instead, they are displayed with the parent Task in a Kanban column. This means that the child Task cannot be moved around the Kanban board independently from its parent Task. Also, any child Task without a schedules/ scheduled by relationship to a Kanban column will not be counted in the Board Progress Widget of the Project Management Dashboard. These relationships must be manually added upon Task creation to allow the child Task to be in a different Kanban column than its parent as well as to be counted in the Board Progress widget.
‘Gantt Chart’ is a new chart type available in Innoslate’s Charts View. Gantt charts are also stored in their sub-view of Innoslate’s Project Management View, ‘Gantt Charts View’. Gantt Charts View can be located by navigating to the view from the main Project Management Dashboard.
Similar to Documents and Diagrams View, Gantt Charts View holds all of the current Innoslate project's Gantt charts in one place. For Gantt charts to populate in this new view, there must be a Gantt Chart label on the Task entity representing the Gantt chart. Gantt Charts View can be used to add, delete, or rename Gantt charts.
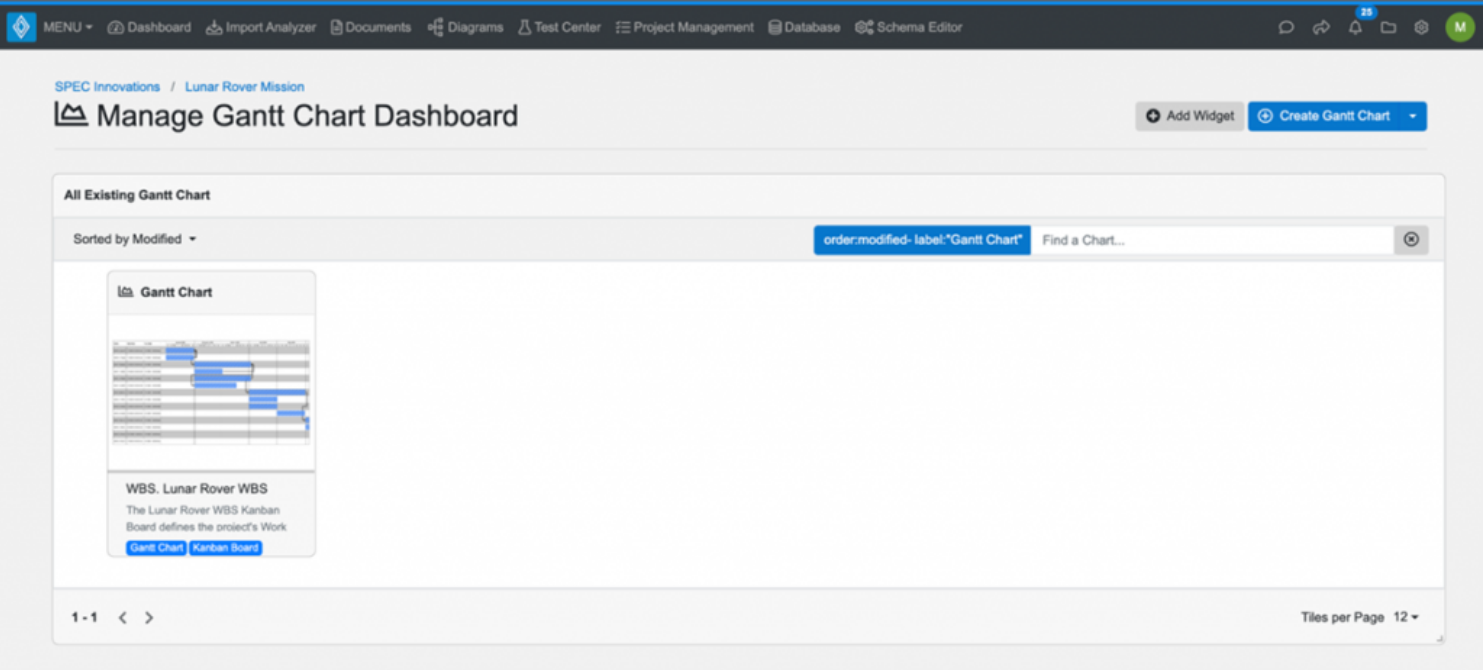
Gantt Charts View
Each panel in the Gantt Charts View is its own Gantt chart with unique Tasks and Dependencies. Search for a Gantt chart using ‘Find a Chart’. Sort through the displayed Gantt charts alphabetically, numerically, most recently modified, or most recently created. Rename or delete any Gantt charts directly in the Gantt Charts View.
Gantt charts can be created directly in the Gantt Charts View. Click the ‘Create Gantt Chart’ drop-down button to display a prompt for creating a new Gantt chart. Enter a Number, Name, and Description for the Gantt chart similar to Documents and Diagrams. The Gantt Chart label will be automatically applied to the Task entity when the Gantt chart is created directly in Gantt Charts View.
The Gantt chart is made up of Task entities connected by Dependency entities. Task entities are represented by blue boxes, and Dependency entities are represented by black arrows. Each row in the Gantt chart is a separate Task entity. Project time is indicated at the top of the Gantt chart.
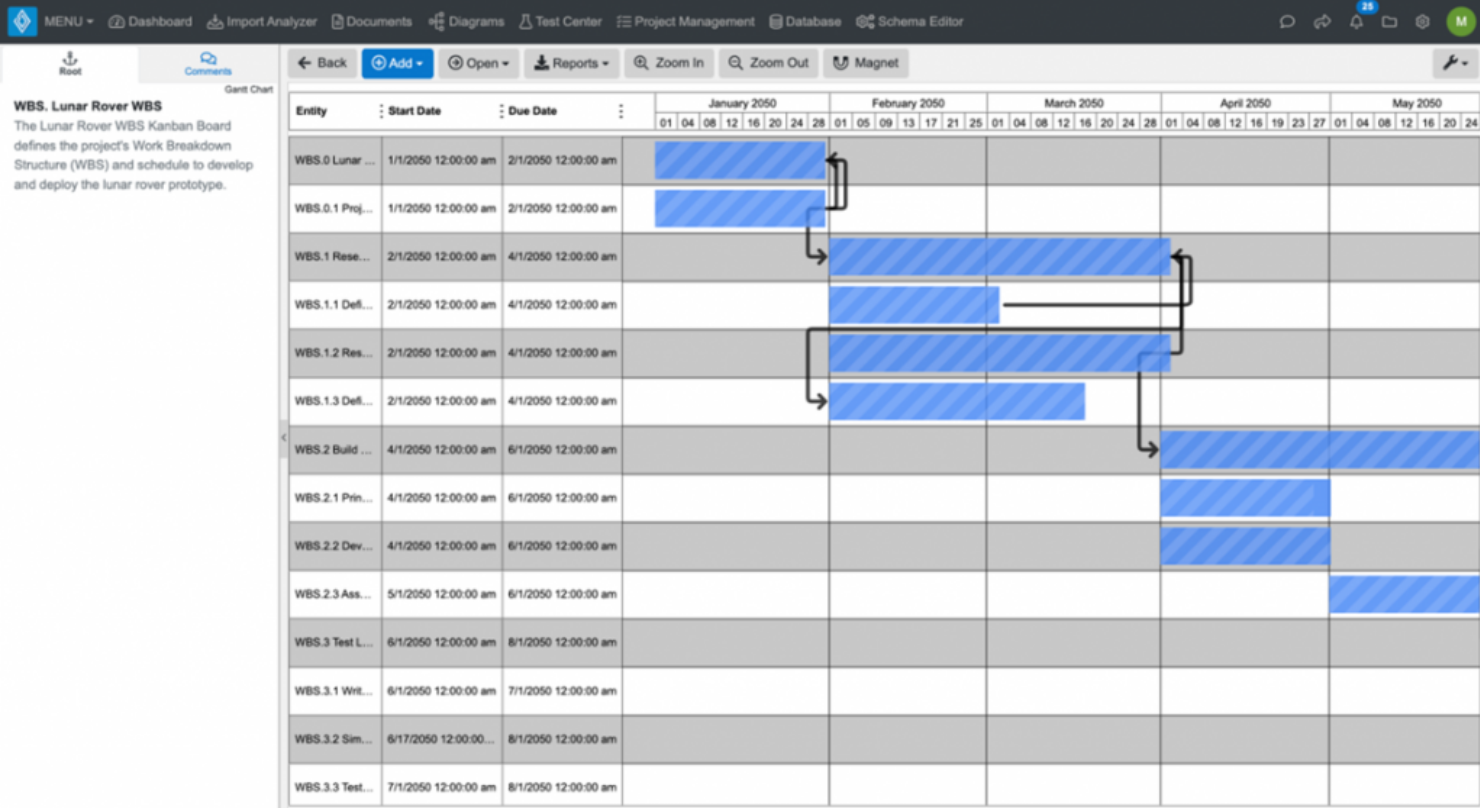
Innoslate’s Gantt Chart
A Gantt chart can also be opened directly from a Kanban board. To view a Kanban board's Gantt, open the Gantt chart directly from the Kanban board using the ‘Open’ drop-down menu at the top of the Kanban board. Once the Gantt chart has been initialized for the Kanban Board and saved as its chart, it can be found in Gantt Charts View and Charts View.
Within Innoslate’s Gantt chart, Dependency entities can be used to connect Task entities. These connections are made using the depends on/ has dependent relationships. Creating dependencies throughout the Gantt chart helps produce a more accurate critical path and predict a more accurate estimated date of completion.
When a Gantt chart is first created or opened from a Kanban board, by default none of the Task entities will be connected using Dependency entities. Each Dependency must be manually created and added to the Gantt chart as desired.
To create a Dependency entity in a Gantt chart, select a Task then click the ‘Add Dependency’ button at the top of the Gantt chart. The border of the selected Task entity will turn orange to signify it is ready to be connected to another Task.
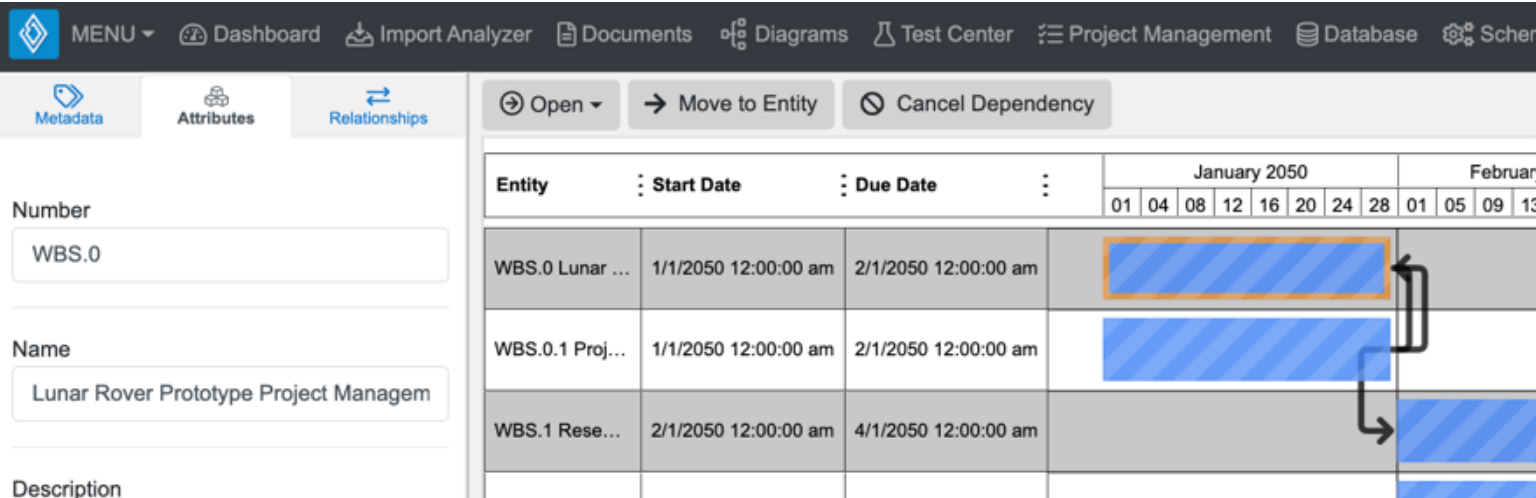
Add Dependency Entity
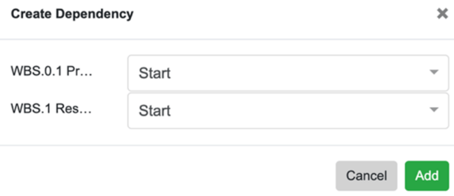
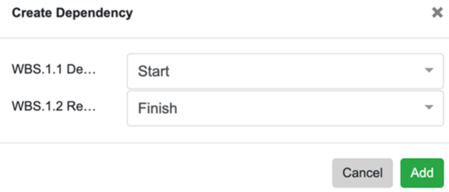
Select another Task entity in the Gantt chart. This will open the Dependency Creation Prompt. Here is where one of four Dependency type combinations must be selected to create the Dependency entity and corresponding relationships.
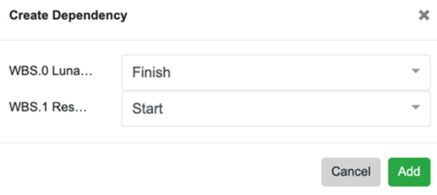
Dependency Creation Prompt
In the Dependency entity creation example above, the first Task selected has attributes: Origin = Yes and Dependency = Finish. The second Task selected has attributes: Origin = No and Dependency = Start. This means the arrow in the Gantt chart will leave the end of the first Task and enter the beginning of the second Task to create the Finish-to-Start Dependency.
Innoslate’s Gantt chart features are similar to any other tool’s Gantt chart. These features include:
Gantt chart settings are also available in the top right-hand corner of the Gantt chart. These Gantt chart settings are similar to those of the Kanban Board and include:
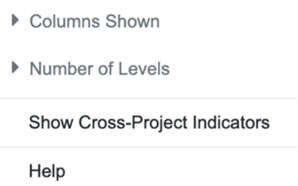
Gantt Chart Settings
In standard project management practice, there are four types of Task-Dependencies used to define predecessors and successors. These Task-Dependencies include:
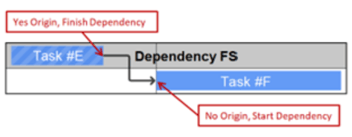
The ‘Finish-to-Start (FS) Dependency’ states that a dependent Task can't start until the Task it depends on is finished. This Task Dependency type is exemplified in the figure below.
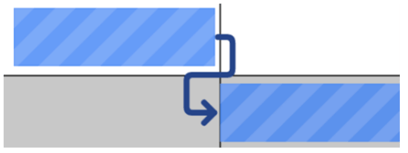
Finish-to-Start (FS) Dependency
In the Dependency creation prompt, this Dependency entity is created by selecting ‘Finish’ for the first Task, then ‘Start’ for the second Task.
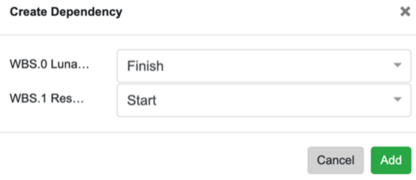
Dependency Creation Prompt
Both the Tasks above, represented by blue boxes, have a depends on relationship with the Dependency entity, represented by the black arrow. The Dependency entity has the has dependents relationship with both the Tasks.
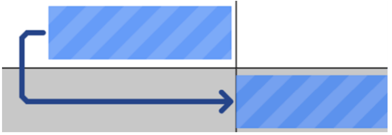
The figure below summarizes the Finish-to-Start Dependency entity and its relationships to two Tasks.
Finish-to-Start (FS) Dependency
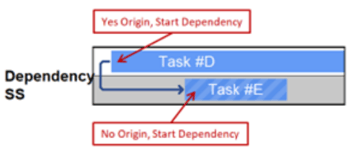
The ‘Start-to-Start (SS) Dependency’ states that a dependent Task can't start until the Task it depends on also starts. This Task Dependency type is exemplified in the figure below.
Start-to-Start (SS) Dependency
In the Dependency creation prompt, this Dependency entity is created by selecting ‘Start’ for the first Task, then ‘Start’ for the second Task.
Dependency Creation Prompt
Both the Tasks above, represented by the blue boxes, have the depends on relationship with the Dependency entity, represented by the black arrow. The Dependency entity has the has dependents relationship with both the Tasks.
The figure below summarizes the Start-to-Start Dependency entity and its relationships to two Tasks.
Start-to-Start (SS) Dependency
The ‘Finish-to-Finish (FF) Dependency’ states that a dependent Task can't finish until the task it depends on is finished. This Task Dependency type is exemplified in the figure below.
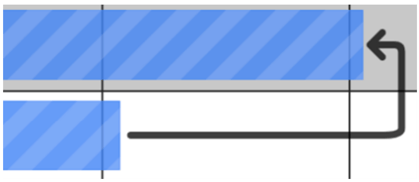
Finish-to-Finish (FF) Dependency
In the Dependency creation prompt, this Dependency entity is created by selecting ‘Finish’ for the first Task, then ‘Finish’ for the second Task.
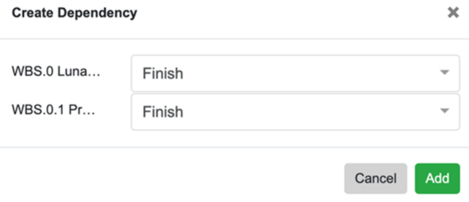
Dependency Creation Prompt
Both the Tasks above, represented by the blue boxes, have the depends on relationship with the Dependency entity, represented by the black arrow. The Dependency entity has the has dependents relationship with both the Tasks.
The figure below summarizes the Finish-to-Finish Dependency entity and its relationships to two Tasks.
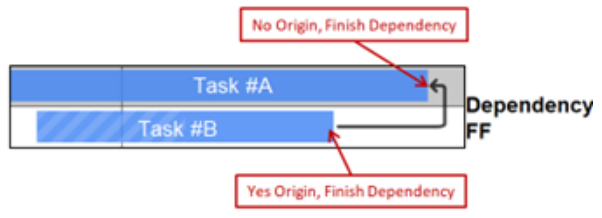
Finish-to-Finish (FF) Dependency
The ‘Start-to-Finish (SF) Dependency’ states that a dependent Task can't finish until the task it depends on starts. This Task Dependency type is exemplified in the figure below.
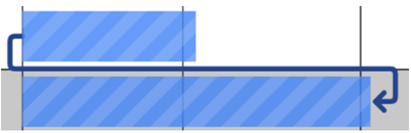
Start-to-Finish (SF) Dependency
In the Dependency creation prompt, this Dependency entity is created by selecting ‘Start’ for the first Task, then ‘Finish’ for the second Task.
Dependency Creation Prompt
Both the Tasks above, represented by the blue boxes, have the depends on relationship with the Dependency entity, represented by the black arrow. The Dependency entity has the has dependents relationship with both the Tasks.
The figure below summarizes the Start-to-Finish Dependency entity and its relationships to two Tasks.
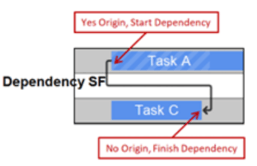
Start-to-Finish (SF) Dependency
‘Calendar Chart’ is a new chart type available in Innoslate’s Charts View. The Calendar chart is similar to the Project Management Dashboard Calendar, however, the events that are displayed in each Calendar chart are customizable by query and multiple Calendar charts can exist at one time in any Innoslate project. Calendar charts are produced from Time entities with the ‘Calendar’ label.
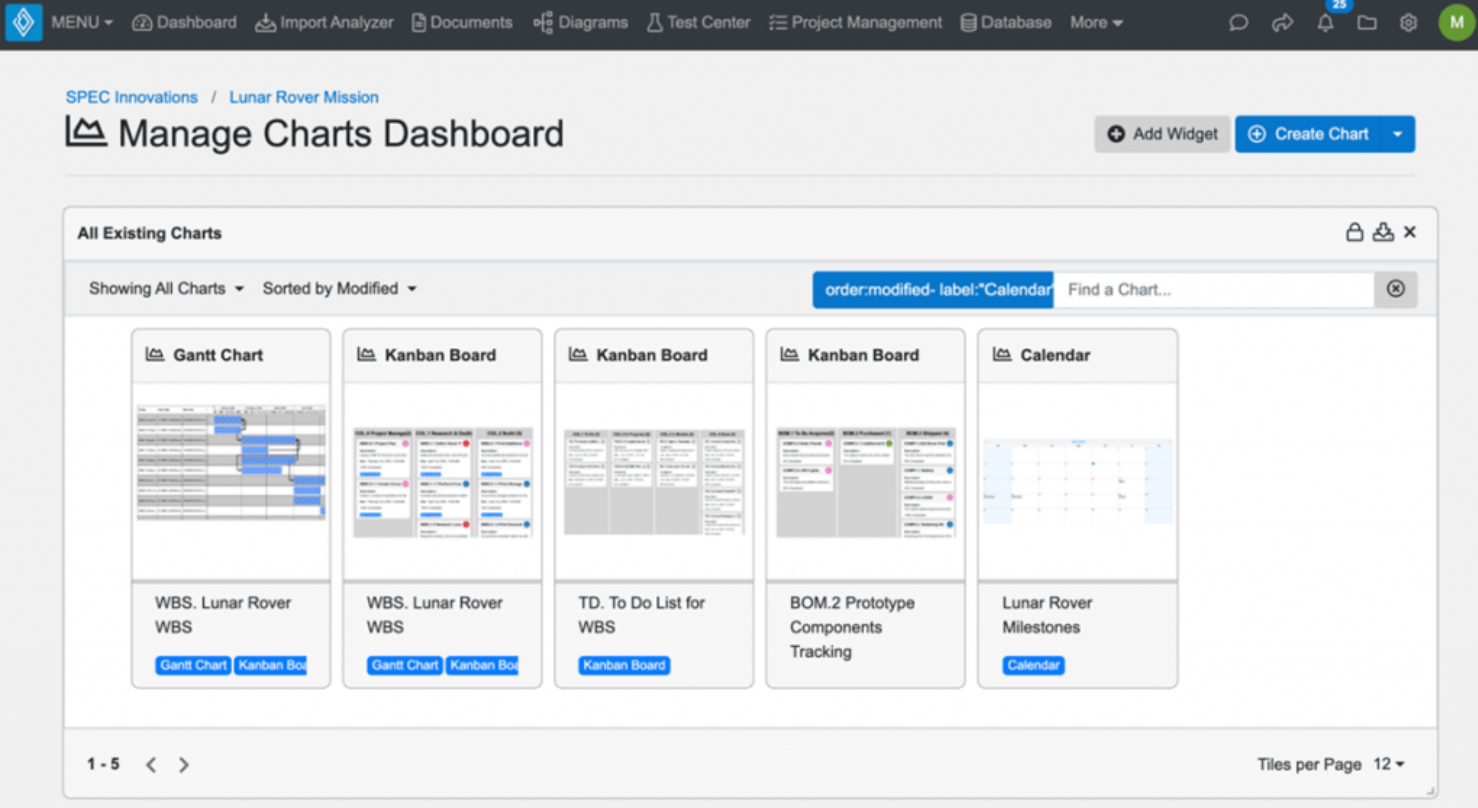
Charts View
The Calendar chart uses custom queries to produce any number of Calendars as needed for a project. The start and due date attributes pulled for various entity event types in the current Innoslate project depends on the query entered during Calendar chart creation. This query functionality is the same used for searching in Innoslate's project Database View.
Click the ‘Create Kanban Board’ drop-down button to display a prompt for creating a new Kanban board.
In Charts View, click the ‘Create Chart’ drop-down button to display a prompt for creating a new Innoslate Chart. In the drop-down menu of Innoslate Chart types, select the Calendar option, then enter a custom query to populate start and due dates for the desired entity type.
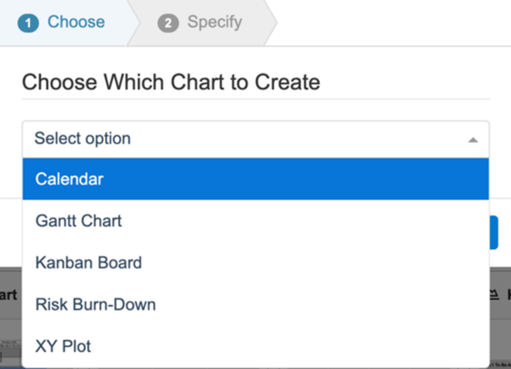
Chart Creation Prompt
Next in the new Calendar chart prompt, enter a Number, Name, and Description for the Calendar chart, similar to Documents and Diagrams. The Calendar label will be automatically applied to the Time entity when the Calendar chart is created directly in Charts View.
By default, all entities with start and due date attributes will populate in the new Calendar chart. Navigate to ‘Change Calendar Query’ to add a filter to the Calendar chart for specific entity class dates.
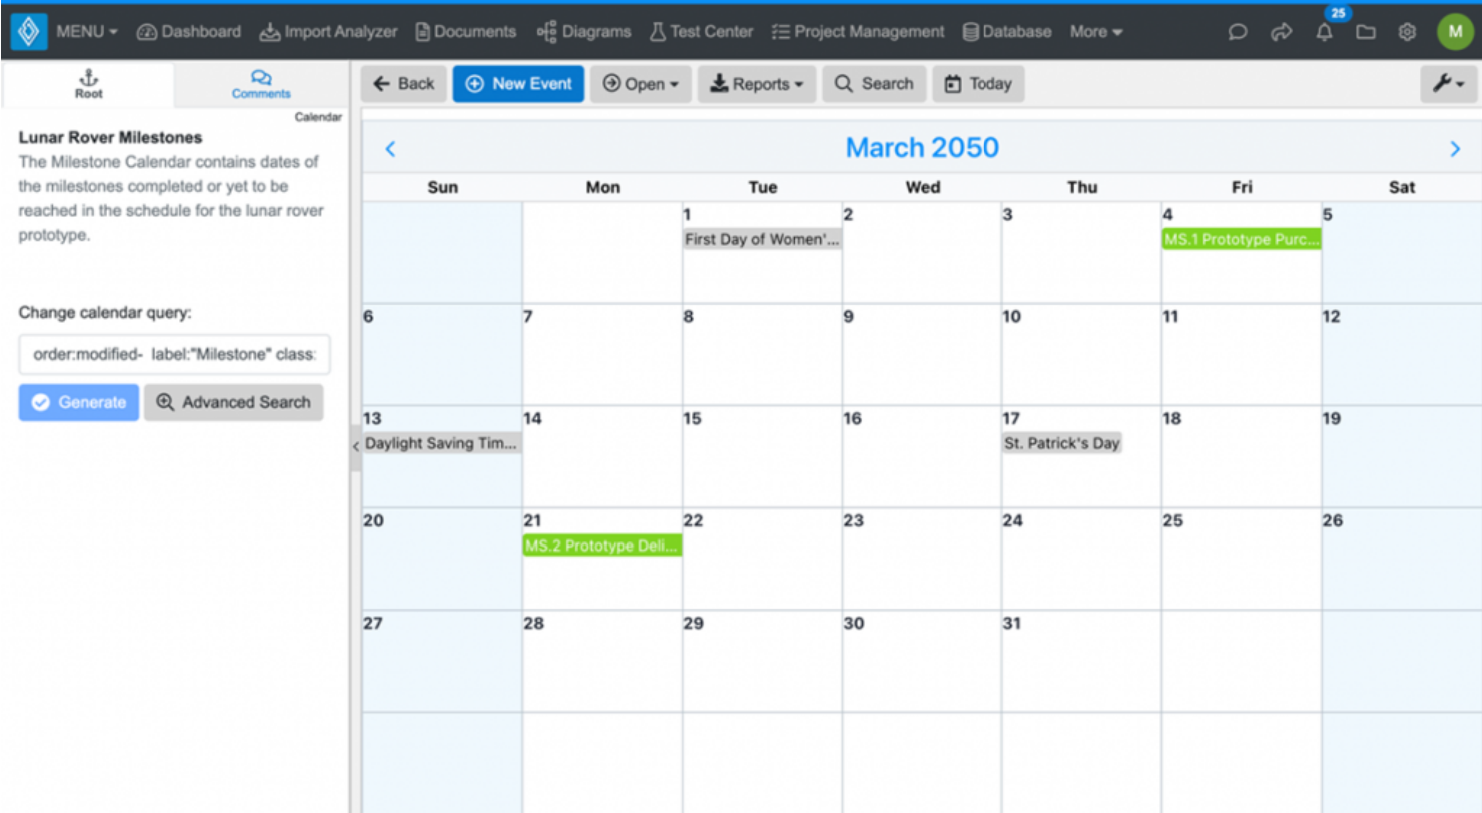
Innoslate’s Calendar Chart
The example Calendar chart query above populates start and due dates only for the Time entities in the current Innoslate project that have a Milestone label: order:modified- label:"Milestone" class:"Time.”
Events, or entities with the start or due date attributes, can be created directly in Innoslate’s Calendar chart. Click the ‘New Event’ button, select which Class to create a new entity, then provide the entity's attributes, including necessary dates and labels.
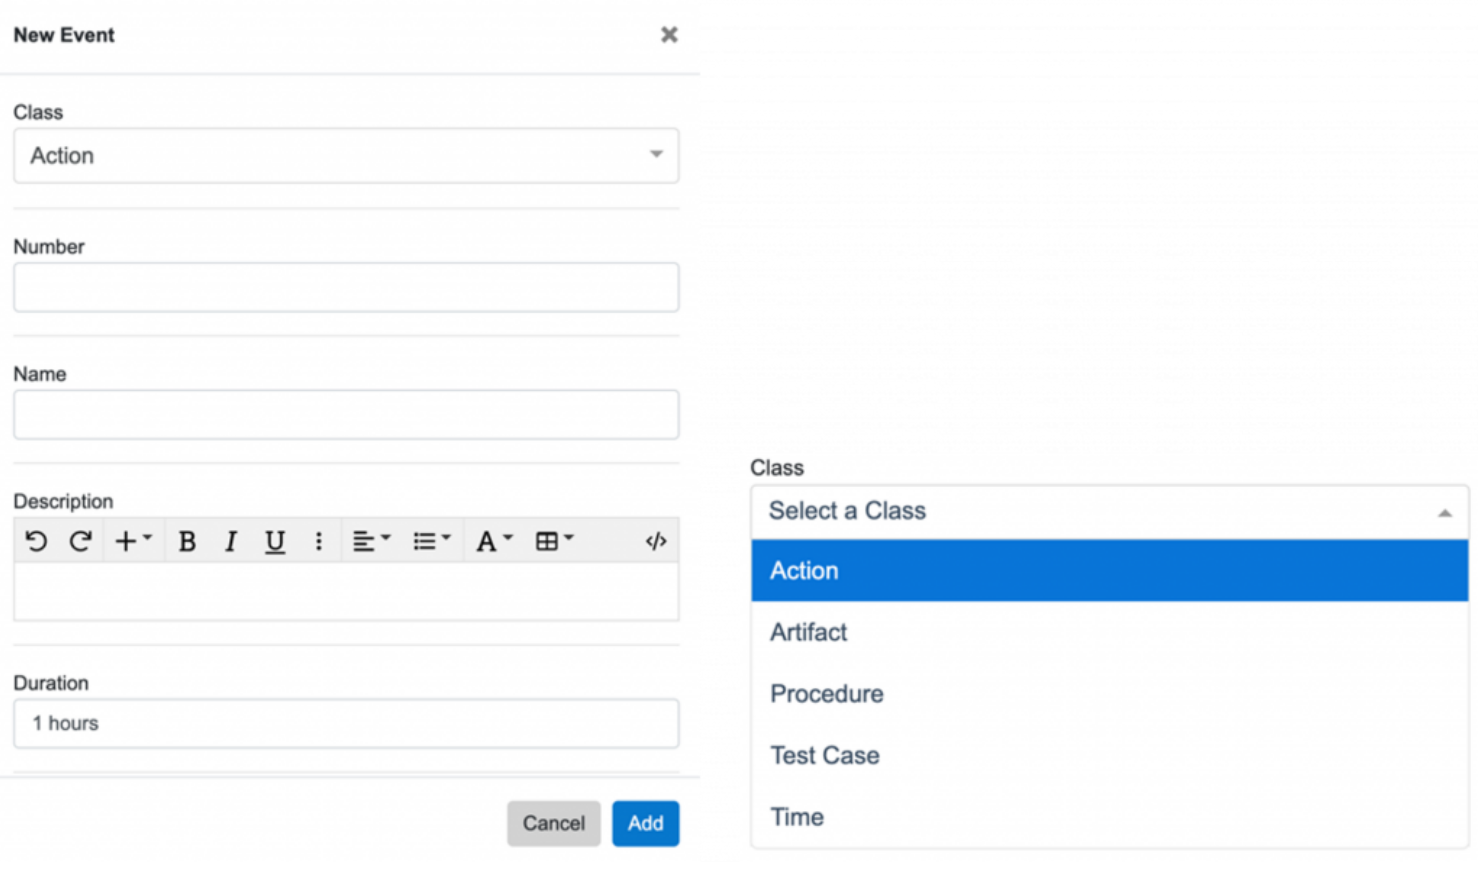
Calendar Event Creation Prompt
Later, change the Calendar chart's query at any time. Simply enter a new Calendar query in the left-hand side query prompt and click ‘Generate’. Doing so will populate a new set of start and due dates in the Calendar chart. Carefully consider the Calendar chart's purpose before generating new dates. For example, the Calendar chart in the previous section is for Milestone dates, so it would not be logical to generate a new query for Kanban Board dates.
Features and settings for the Calendar chart are different than that of the Project Management Dashboard Calendar.
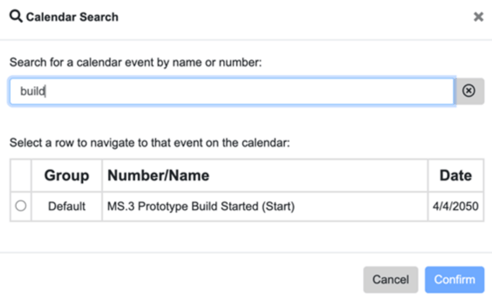
Calendar Event Search Prompt
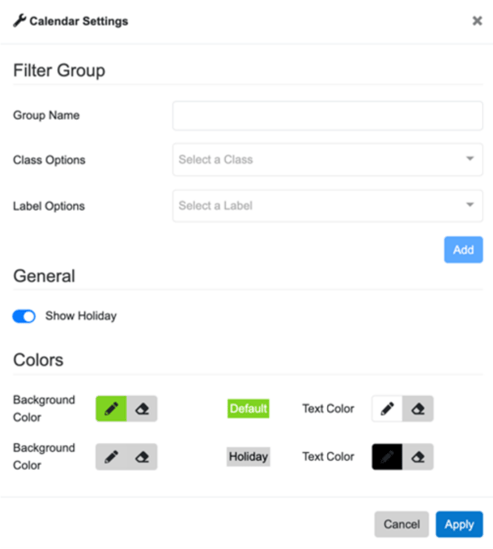
Calendar Chart Settings
Are you tired of cumbersome documentation processes? Innoslate offers a seamless solution for managing your systems engineering lifecycle. Experience the ease and efficiency firsthand. Get started with Innoslate today!
Project Management and Model-Based Systems Engineering (MBSE) are closely intertwined disciplines, especially in the context of managing complex...
.png)
Want to sit back, relax, and listen? Watch the webinar recording!
2 min read
Don't feel like reading? Watch the webinar recording. Effective requirements management is crucial for the success of any project. As...