
.svg) SPEC Innovations Team
SPEC Innovations Team


How to Involve Stakeholders in Requirements Validation
Validation is concerned with whether the system fulfills its intended purpose and meets the user’s requirements. It answers the question: "Are we...
.svg)
Don't feel like reading? Watch the video instead!
By Amir Abrari, Dominic Galarza, and Chris Howard
In a world where precision and efficiency are key, even the most magical of operations need a touch of modern engineering, and Santa Claus is no exception. This blog explores Santa's process through the lens of systems engineering to ensure the seamless execution of his annual mission.
We will unravel the hidden mechanisms that keep Santa's workshop running with efficiency through:
So, fasten your seatbelts, grab a cup of hot cocoa, and embark on a sleigh ride through the enchanting process of Santa, the Systems Engineer.
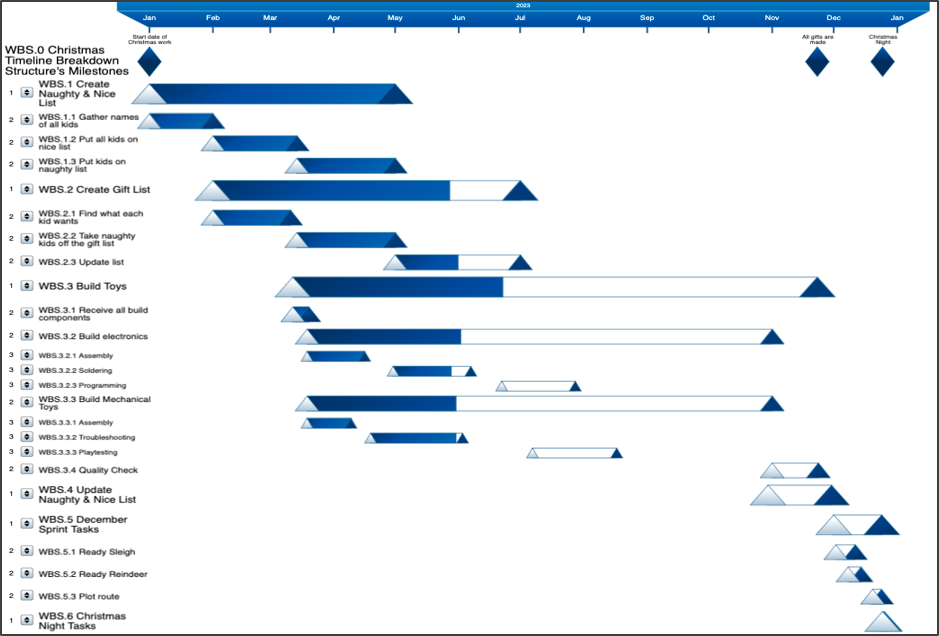
Innoslate’s timeline diagram holds all tasks that will be completed before and during Christmas Night. The timeline diagram allows users to keep track of deadlines and project needs. This feature allows for project risk mitigations such as project delay.
Santa’s Christmas Timeline includes deadlines such as creating gift lists, nice and naughty lists, Christmas Day route planning, etc. All tasks and events have been analyzed throughout this project using Innoslate.
This diagram also includes Milestones throughout the project that must be completed by the assigned deadline. This feature attributes task descriptions, begin/end dates, due dates, task durations, current status, assignees, and task percentage completions.
Additionally, users can customize the timeline length and overall duration based on their needs. In this example, the timeline length is for a year. However, it can be adjusted for as long as the user needs using the “Adjust Timescale” button.
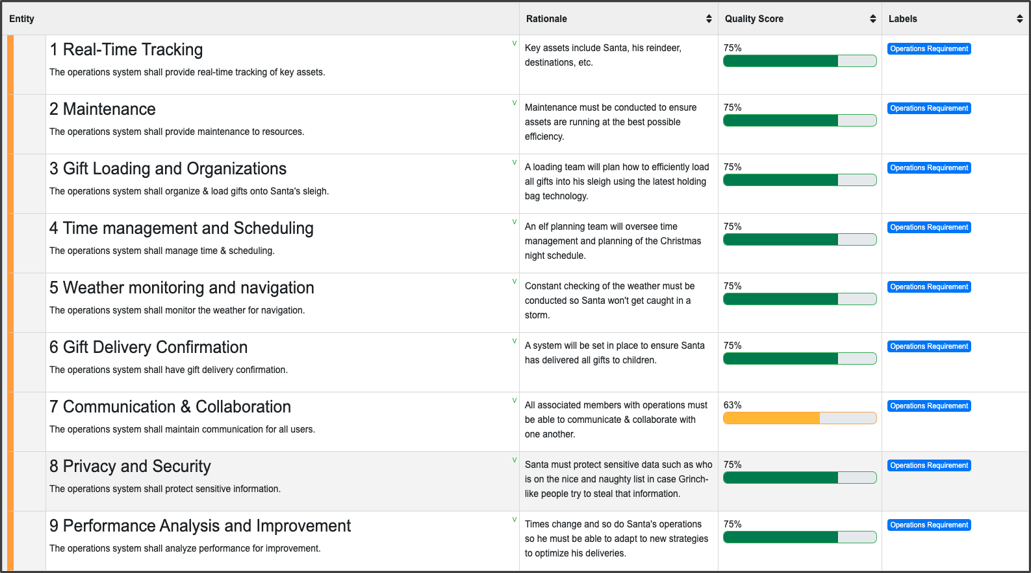
Requirements Documentation is an essential component of systems engineering. Using the requirements document on Innoslate, our team conducted detailed requirements engineering creating many requirements on the mission, operational, functional, and performance aspects of the project.
Each requirement follows the INCOSE guidelines for requirements engineering. This feature includes the entity, the requirement, its rationale, quality score, appropriate labeling, and requirement status. Each element is essential in documenting the requirements to be later traced and verified in the project.
The quality score takes into factor: Clear, Complete, Consistent, Correct, Feasible, Traceable, and Verifiable requirements components and scores each requirement accordingly. The INCOSE guidelines help generate a quality score to help the user create the most optimal requirements.
The document view enables entities to display letters such as “v” or “t” to indicate relationships with other entities.
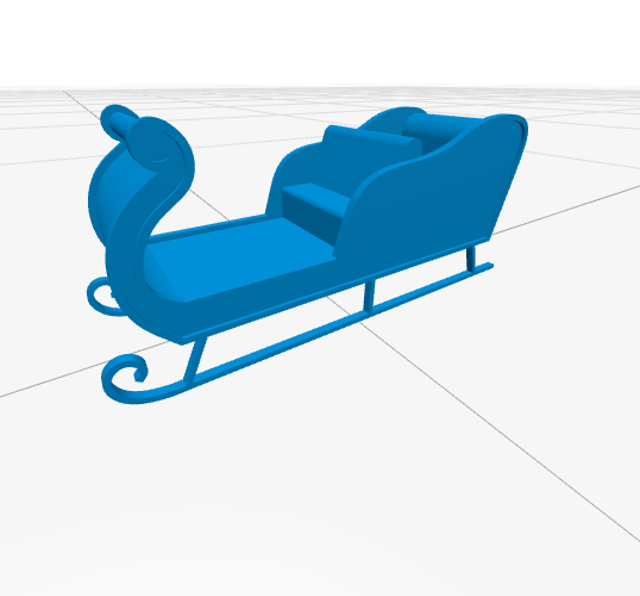
Overall, the V1 design of the sleigh is relatively basic. The model that is shown is likely the first thing you would think of when it comes to Santa's Sleigh: rounded on the edges, and two bars on the bottom with flourishes at the ends. In addition, there is also a bench-style seat, with space for Santa's gift sack behind it.
V1 Sleigh Design
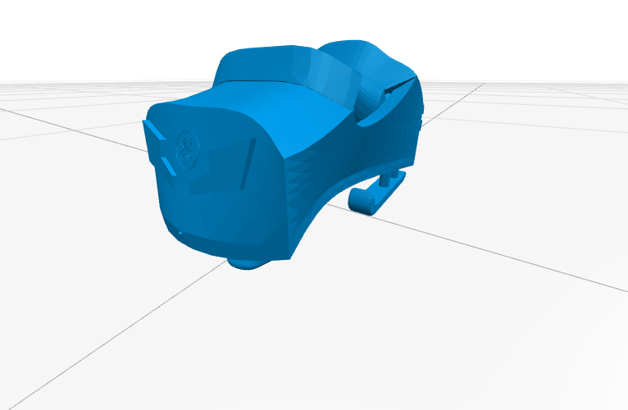
The V2 design improves upon the technical aspect of the previous iterations of Santa's Sleigh by adding one big feature: lighting. As you can see in the model, the new sleigh design now has headlights towards the front.
V2 Sleigh Design
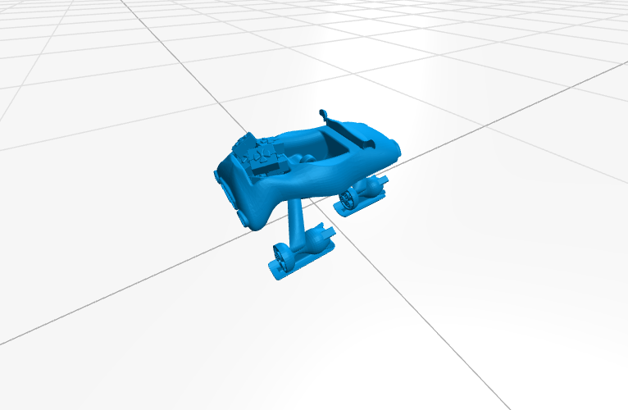
The V3 model adds a futuristic flavor to the previously bland designs of Santa's Sleigh. In addition to those stylistic changes, another big addition is the rocket engines that can be seen towards the back, next to the gift compartment.
V3 Sleigh Design
The V4 design changes the futuristic aspect of V3 into a more industrial, practically speaking first, type of design. In addition to the rockets from V3, V4 also adds fans to increase lift.
V4 Sleigh Design
In V5, each of the best parts of previous models is incorporated. The looks of V1, the lights of V2, the rockets of V3, and even the fans on V4.
V5 Sleigh Design
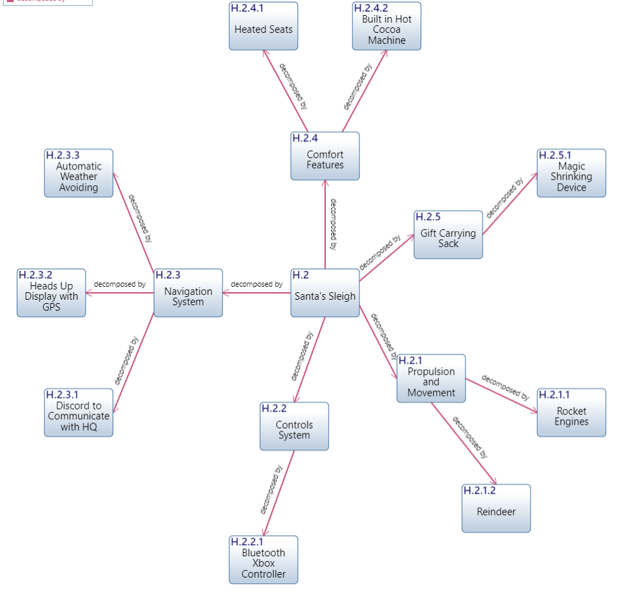
We created a spider diagram referencing Santa’s Sleigh, showing relationships between each of the different parts. This spider diagram can also be viewed as a hierarchy diagram and can be found in the diagram section of Innoslate.
The relationships between the assets in the spider diagram are rooted in the hierarchy diagram, which has Santa’s Sleigh as the root, with each of the arrows pointing outward be branches of the root. Then, once the diagram is decomposed, we are given the relationship between the assets.
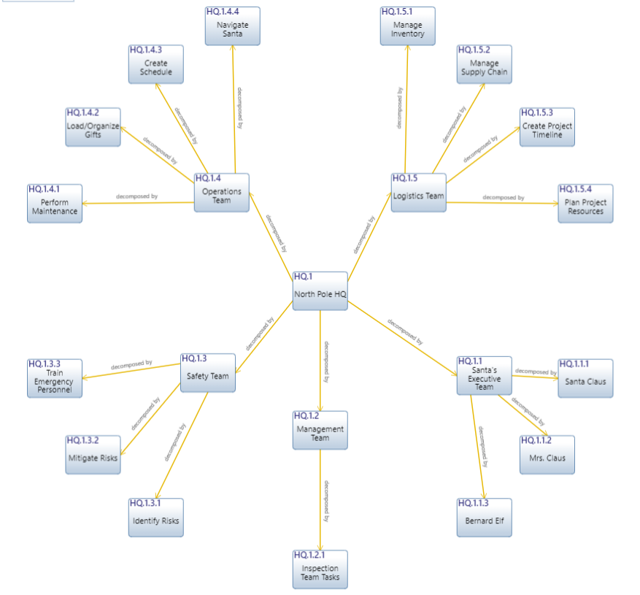
Similar to the spider diagram referring to sleigh components, the hierarchy of Santa’s HQ at the North Pole can be broken down into a simple diagram.
The ranking system using the radar charts will be used to “rank” the reindeer in order of importance and priority based on the system's needs. We will be using this demonstration to show Innoslate’s ability to communicate attributes and comparative advantage of certain components against one another. It is important to note why this demonstration is being done and how it will help Santa.
%20(500%20%C3%97%20700%20px)%20(600%20%C3%97%20700%20px)%20(1000%20%C3%97%201000%20px).png?width=1000&height=1000&name=Untitled%20(400%20%C3%97%20700%20px)%20(500%20%C3%97%20700%20px)%20(600%20%C3%97%20700%20px)%20(1000%20%C3%97%201000%20px).png)
This organizational ability allows for the user to differentiate the lists, and decide on various elements of the project. Each list has a unique number of elements that create the query.
Different labeling allows for the user to have a personalized experience when integrating their project. The user can also enable multiple labels, leading to the system identifying common denominators within the query list that apply to both. Such ability can potentially create an extensive and capable dynamic list for Santa.
Labels can be created in the schema editor, so it is important to note that they can be added or removed at the discretion of the project owners. As a result of that, Innoslate has the ability to customize the project in endless ways so that Santa can deliver the best Christmas.
The labels are created through two main focuses: Continental List and Gift Category (Apparel, Toys, Electronics).
The nice list query focuses on kids from all regions that have been good. The query will include entity properties such as gift list, country, region, and home address available at Santa’s disposal.
The query list is created to save progress and order of operation for a standardized process for Santa. Meaning that the list is created to be at the user's disposal to view a personalized list.
This query list can be customized based on the user's needs. Using filters and sorting features in the database, we are able to create queries and lists that we would like to view periodically based on the work being done.
In this example, Santa needs a query list of the kids that have been nice, the gifts they have asked for, the countries they are in, and their home addresses. This will help Santa create a list of what needs to be done, the regions of gifts, and their home addresses upon the delivery of gifts on Christmas.
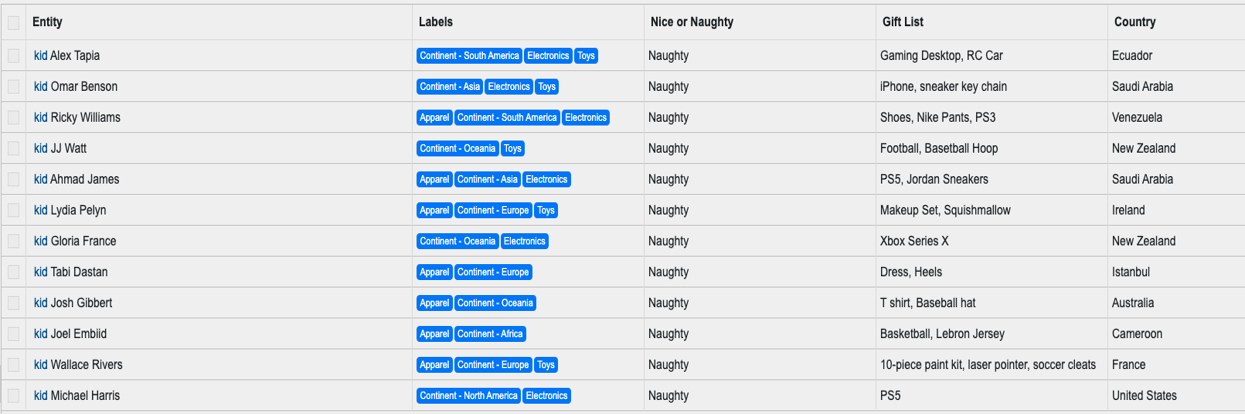
The naughty list query focuses on kids from all regions that have been bad. The query will include entity properties such as gift list, country, region, and home address available at Santa’s disposal.
This is an asset diagram, which displays Santa’s travel path during the night of Christmas. The background of the asset diagram has also been changed to a time-zone map below. Using the asset diagram, we are able to integrate background images to help illustrate a model into an image to help better communicate and model a plan better.
In this example, our team has planned out the routing scenario for Santa that best utilizes and optimizes Santa’s travels around the world. Such illustration is a great method of communicating the travel plan, as well as using the asset diagram to simulate the plan and estimate results.
The test center is created to allow for verification and validation of our requirements and processes as the project has followed the V-Model throughout the lifecycle of the project.
The test center includes the entity, its expected results, actual results, status and its progress roll-up, and related labels. These components can be deemed extremely helpful in utilizing a test management tool that will accelerate system/project testing in any environment.
It is important to note that these structural attributes can always be adjusted and catered to the stakeholder's needs. You can always add/remove certain attributes such as a description bar for mitigation strategies, why tests failed or succeeded, etc.
Labels can also be helpful in categorizing the test results into less marginalized information in specific sectors. For example, if the testers wanted to identify tests needed to be done in the “demonstration verification” sector, they can click the label for it and only focus on those tests and their roll-ups.
Additionally, test center entities, like any other, can be related and linked using the relationship tab on the left. This creates traceability to requirements created for direct verification and validation of our requirements.
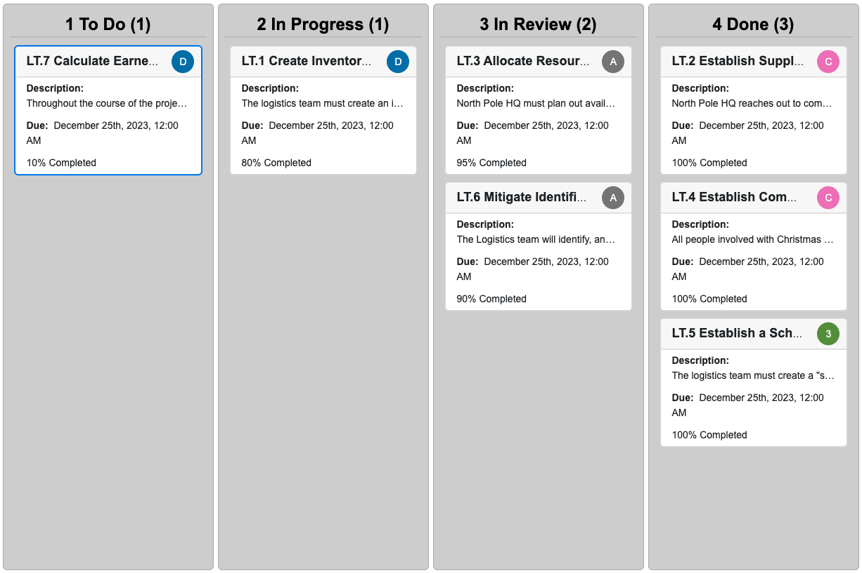
To-do lists are an essential part of project management. The Kanban board aims to create an interface for project managers to lead projects and divide up tasks on a project between different assignees. This allows for appropriate task assignments and a well-designed process of communication between project leads and assignees.
On the Kanban Board, you can create desired columns and tasks to have a catered and customized experience. Whatever your project needs, the Kanban board can help. It creates an interface with the goal of creating proper project management for team leads.
Innoslate’s kanban board enables the project manager to create a description of the task, assign users to the entity, set due dates, set estimated dates of completion and finish dates, track task status, completion percentages, and move entities between the stages upon the completion of the activity.
The kanban board can also be converted to any SysML or LML graphical presentations available on Innoslate using the “Open” tab. The Gantt chart is a notable feature that can work hand in hand with the Kanban Board in the Project Management section.
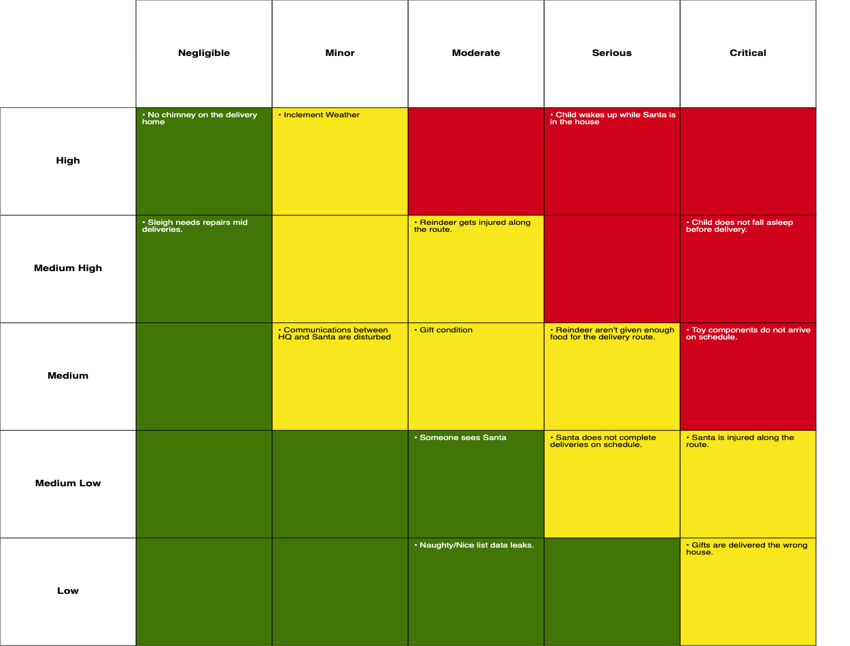
Santa does risk evaluation for Christmas day in order to be fully prepared for what's to come. In order to do so, Santa has to list all the possible risks he could face and evaluate each risk based on its consequence and probability of happening.
The Consequence x Probability percentages attributes indicate the location of each risk on the table. Depending on the numerical percentages of each element, the risk will be positioned in a specific column/row based on the importance of the risk. It is crucial for the team to conduct risk analysis in order to ensure the safety and success of Santa’s work.
Each risk has attributes that will allow the user to conduct the proper analysis. These attributes include description, consequence description, consequence and probability percentages, and current status of the risk (Open, Duplicated, Declined, and Resolved).
The action diagrams are created in order to map the start-end progression of tasks based on time, duration, and start and end dates. It is important to note that the action nodes are directly exported from the timeline diagram and the WBS structure, allowing for simultaneous updating and progression toward project goals.
The action diagrams allow users to simulate their nodes using either “Monte Carlo” or “Discrete Events.” Both are MBSE simulators that help elevate our project when simulating the Christmas timelines.
Monte Carlo is a powerful simulator used in Innoslate to model and analyze uncertainties. It runs multiple iteration simulations with randomly generated inputs, providing valuable insights and risk assessment.
Discrete Events is a simulator in Innoslate that allows for the modeling of complex systems through the sequencing and timing of events. This enables an understanding of system model behaviors and performance.
Below is a simulation regarding the overall timeline of Christmas preparations. This is an action diagram simulated with the Discrete Event simulator which follows the events of the timeline diagram seen earlier. It also displays the amount of time required to complete all the tasks and shows a timeline of such events using the Gantt chart at the bottom of the window.
Through incurring costs to the time simulations, we were able to create costs per hour for the Building Toys entity. This allows us to estimate total costs for the project over time.
Doing the cost simulation allows for the user to create a precise estimate of what to expect on how much to budget on the project to remain feasible.
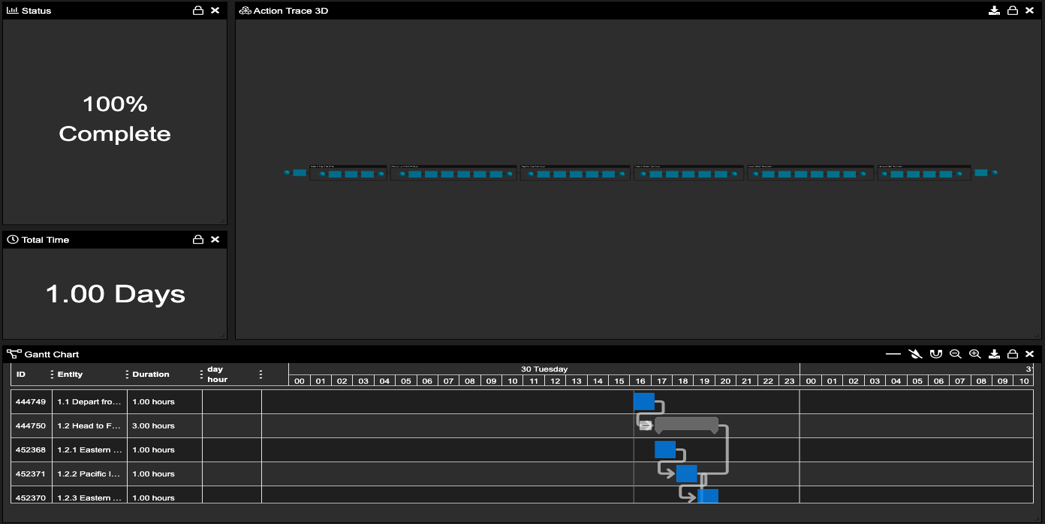
Below is an action diagram (run through the Discrete Event simulator) that shows the amount of time it takes for Santa to deliver gifts across the world. It is important to note that the action diagrams have been decomposed into other action diagrams with assigned durations, start times, etc.
Below is the view once inside the simulation. As we can see, the action diagram runs through each block, each of which has certain conditions. In addition to that, using the Gantt chart can also visualize the amount of time spent in each region/time zone before Santa moves on to the next region.
As we draw the curtains on this whimsical yet enlightening exploration of Santa's role as a Systems Engineer, we've uncovered the meticulous planning and cutting-edge technologies that make Christmas Eve a seamless and magical experience for children around the world. From the precise timelines and requirements documentation to the evolution of Santa's iconic sleigh and the strategic use of radar systems, Santa's Workshop is a marvel of modern engineering.
With tools like the Kanban board, risk evaluation, and time simulation analysis, Santa's team ensures that every detail is accounted for and that the spirit of giving is never compromised. It's a testament to the adaptability of technology in even the most traditional of settings. As we bid farewell to Santa, the Systems Engineer, we can't help but marvel at how innovation and tradition come together to make the holiday season truly special. Merry Christmas and Happy Holidays!
Watch the webinar recording here to learn even more!

Validation is concerned with whether the system fulfills its intended purpose and meets the user’s requirements. It answers the question: "Are we...

Aligning requirements with stakeholder needs and expectations is a cornerstone of successful systems engineering. When done effectively, this process...

Unrealistic expectations from requirements management stakeholders can pose significant challenges to a project. However, addressing these...