Failure Mode and Effects Analysis (FMEA) helps engineering teams answer an important question before problems occur: What could go wrong, and what should we do about it?
FMEA provides a structured process for identifying potential failure modes, understanding their causes and effects, evaluating risk, and determining which failures require the most attention.
But understanding the definition of FMEA is only the beginning. To get value from the analysis, engineering teams need to know how to conduct a FMEA and apply the results to engineering decisions.
In this guide, we'll walk through the FMEA process step by step using a vehicle as a practical FMEA example. We'll also show how to model and simulate the analysis in Innoslate to better understand the potential cost, schedule, and performance impacts of different failures.
What is the FMEA process?
The FMEA process systematically examines the ways a product, process, or system could fail and the consequences of those failures.
According to the American Society for Quality (ASQ), FMEA is a step-by-step approach for identifying potential failures in a design, manufacturing or assembly process, product, or service.
Although the exact FMEA steps can vary depending on the methodology, industry, and organization, an analysis generally involves:
-
Defining the scope of the analysis
-
Identifying system functions or processes
-
Identifying potential failure modes
-
Determining the effects of each failure
-
Identifying potential causes
-
Evaluating and prioritizing risk
-
Identifying actions to reduce risk
-
Reviewing and updating the analysis
As IBM explains in its overview of FMEA, the process moves from understanding the system's structure and functions to identifying potential failures, analyzing risk, taking corrective action, and documenting the results. This structured approach helps teams turn potential failures into actionable priorities.
Regardless of the methodology, FMEA should not be treated as a one-time exercise. The analysis should evolve as the system changes and new information becomes available.
For our FMEA example, we'll consider vehicle operation and several potential failures that could interrupt normal operation.
Step 1: Define the scope of the FMEA
Before identifying failures, establish what you are analyzing. The scope could be an entire system, a subsystem, an individual component, a design, or a process. Clearly defining the scope keeps the analysis focused and helps the team determine which functions and potential failures to consider.
For our example, the scope is vehicle operation.
Under normal conditions, the vehicle continues operating. However, our analysis considers what happens when a failure interrupts that operation.
In Innoslate, this process can be represented visually using an Action Diagram.
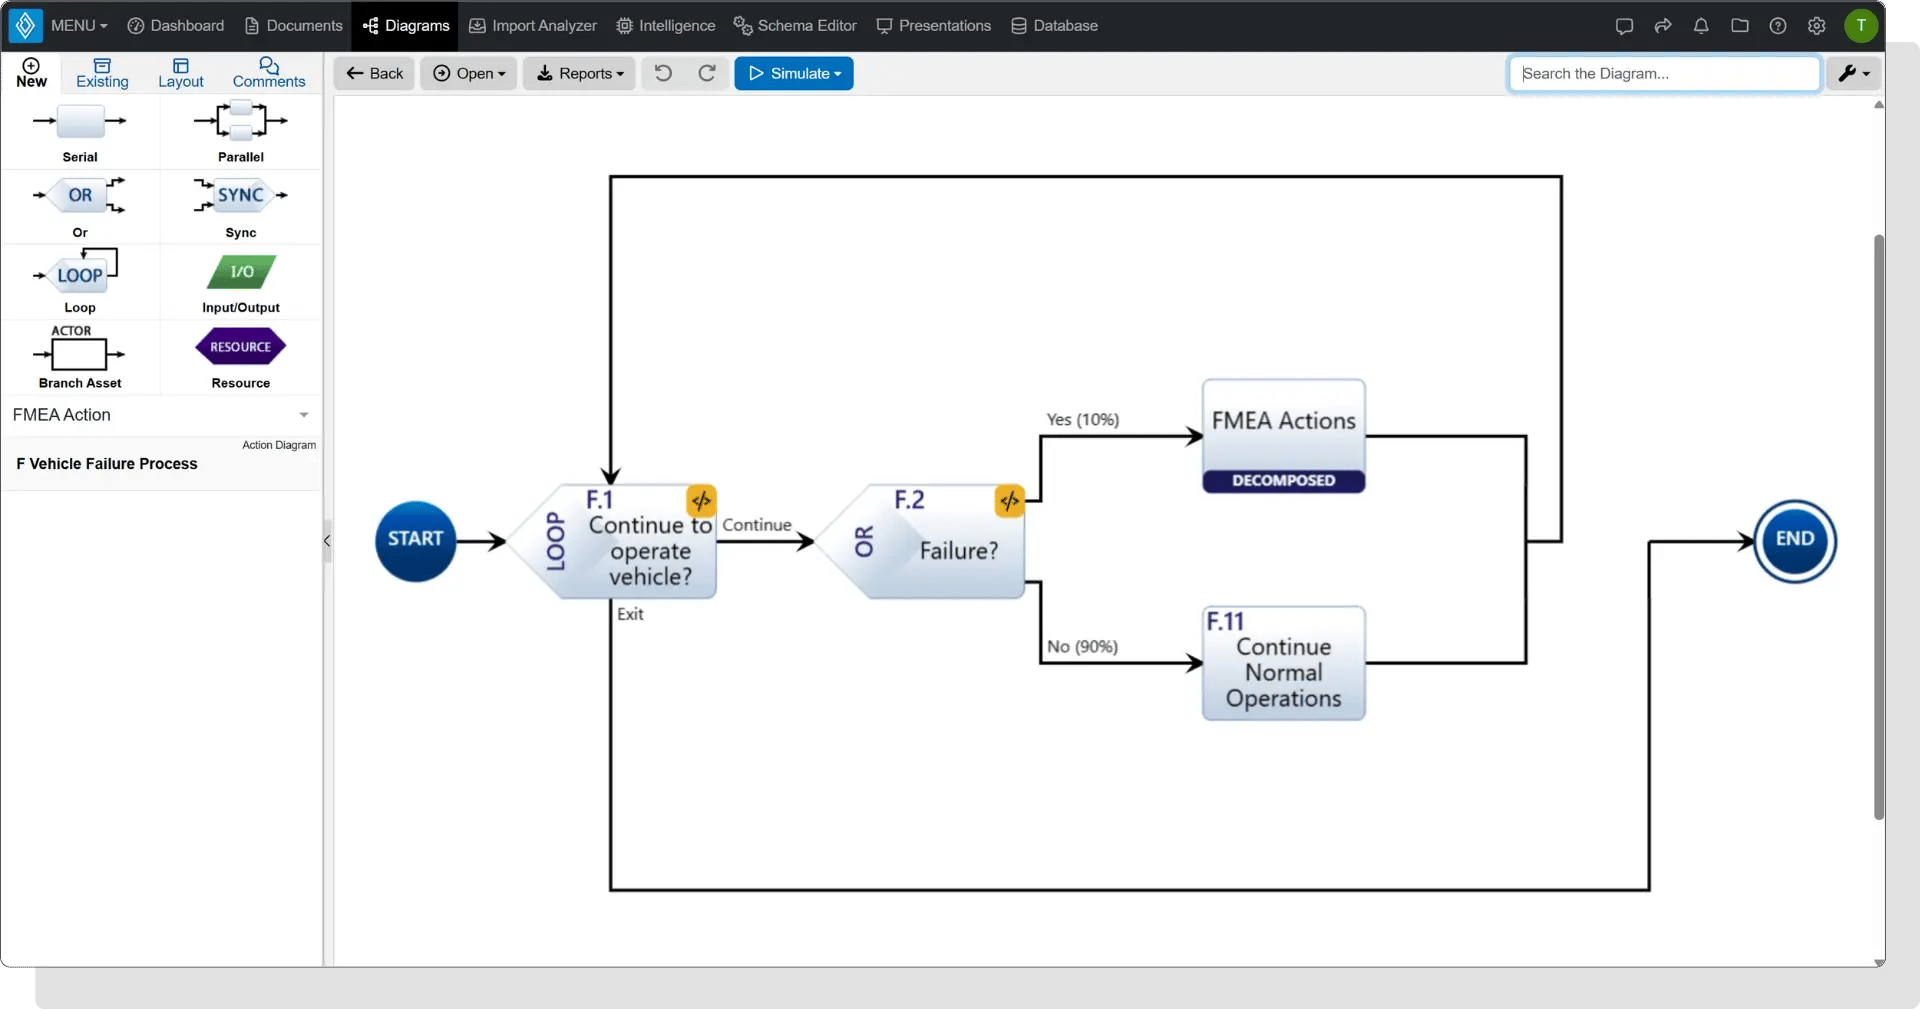
The vehicle model continuously evaluates whether operation should continue and whether a failure has occurred. In the example model, there is a 10% probability that a failure will occur during the analysis. When no failure occurs, the vehicle continues normal operation. When one does occur, the model proceeds to the FMEA actions associated with the failure.
This creates the foundation for examining not just individual failures, but how those failures affect the larger operational process.
✏️ Note: We picked 10% and other percentages to make it easy to see results without many iterations. We understand that if you had a car that failed 10% of the time, you would consider it a “lemon” and replace it as soon as possible!
Step 2: Identify potential failure modes
Next, identify the ways the system could fail to perform as intended. A failure mode describes a specific way a component, function, process, or system could fail.
For our vehicle FMEA example, we'll examine three potential failure modes:
-
Flat tire
-
Out of gas
-
Engine failure
Each failure interrupts normal vehicle operation differently and requires a different response.
In the Innoslate model, these failures are assigned different probabilities:
-
Flat tire: 50%
-
Out of gas: 30%
-
Engine failure: 20%
These percentages represent the relative probability of each failure scenario within the example model after a vehicle failure occurs.
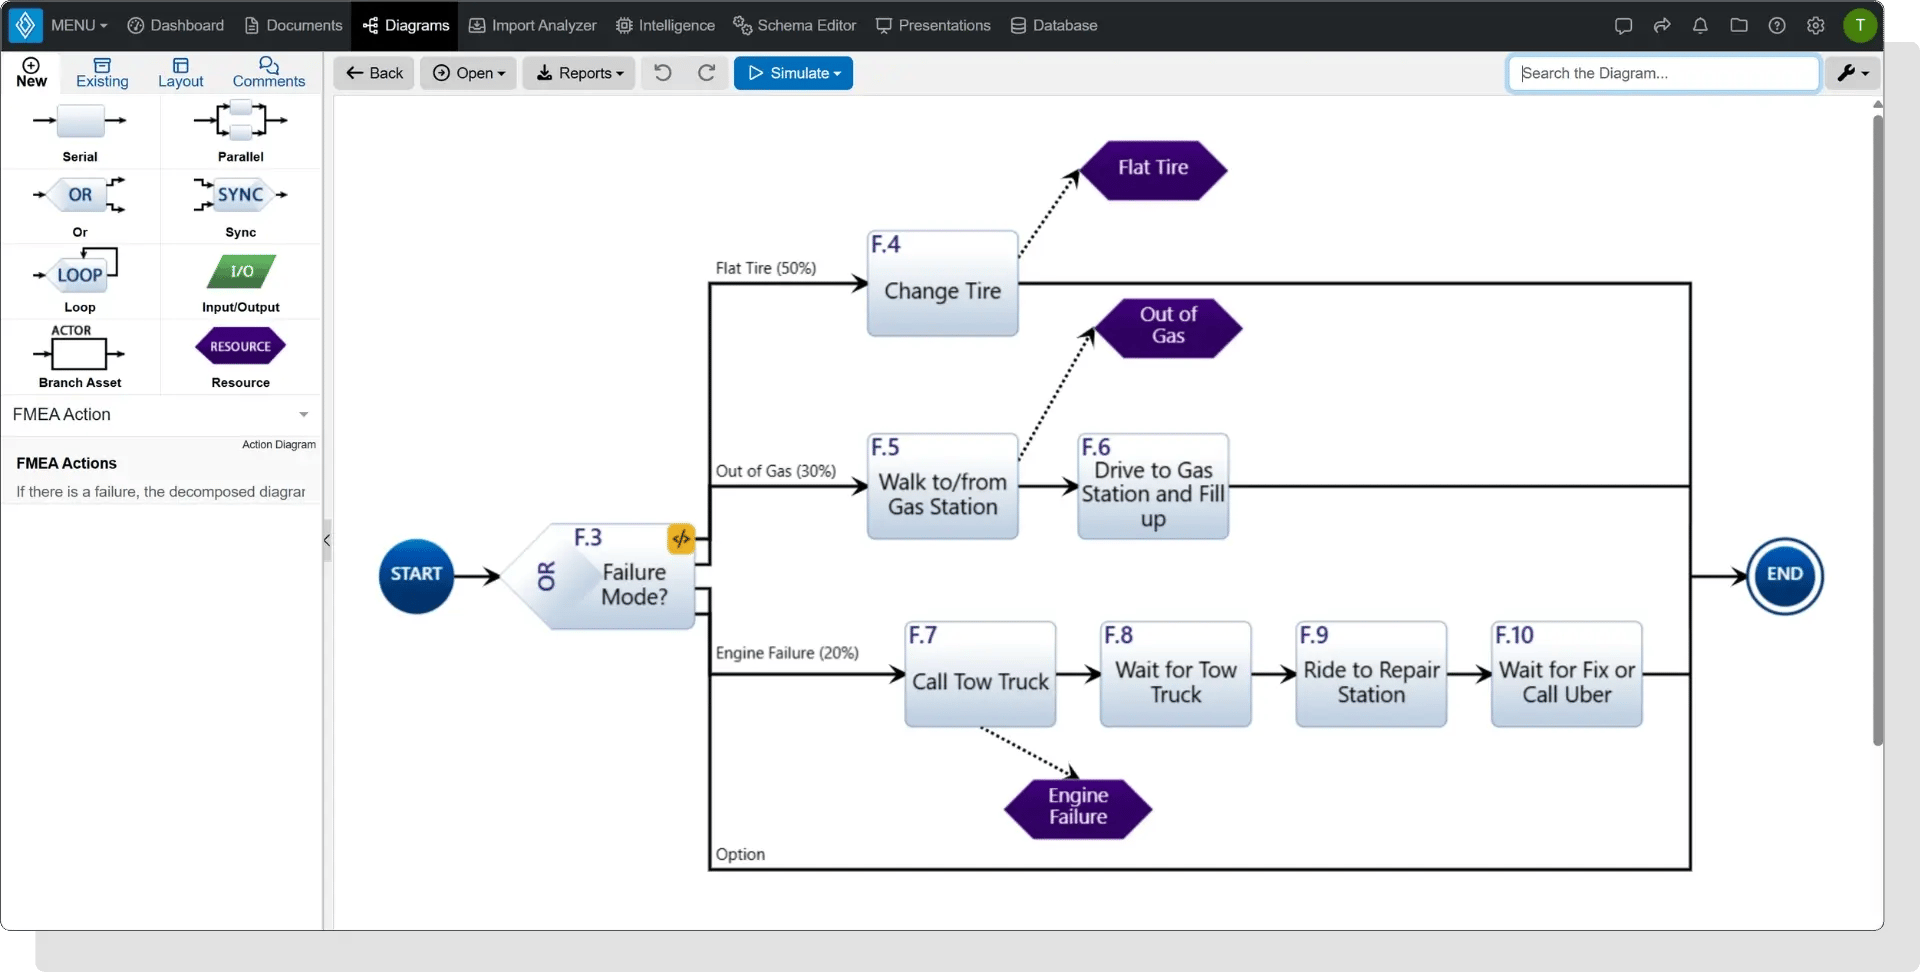
Visualizing the failure modes within the model makes it easier to understand how each one branches away from normal operation and what needs to happen afterward.
Step 3: Determine the effects of each failure
Identifying a failure mode is only part of a FMEA. Engineers also need to understand what happens when the failure occurs. These are the failure's effects.
For the vehicle example, a flat tire prevents normal operation until the tire is changed. Running out of gas interrupts operation until fuel can be obtained. An engine failure can have a much larger operational effect because the vehicle may need to be towed and repaired before normal operation can resume.
A simplified view looks like this:
| Failure Mode |
Potential Effect |
| Flat tire |
Vehicle cannot continue normal operation until the tire is changed |
| Out of gas |
Vehicle becomes temporarily inoperable until fuel is obtained |
| Engine failure |
Vehicle requires towing and repair before operation can resume |
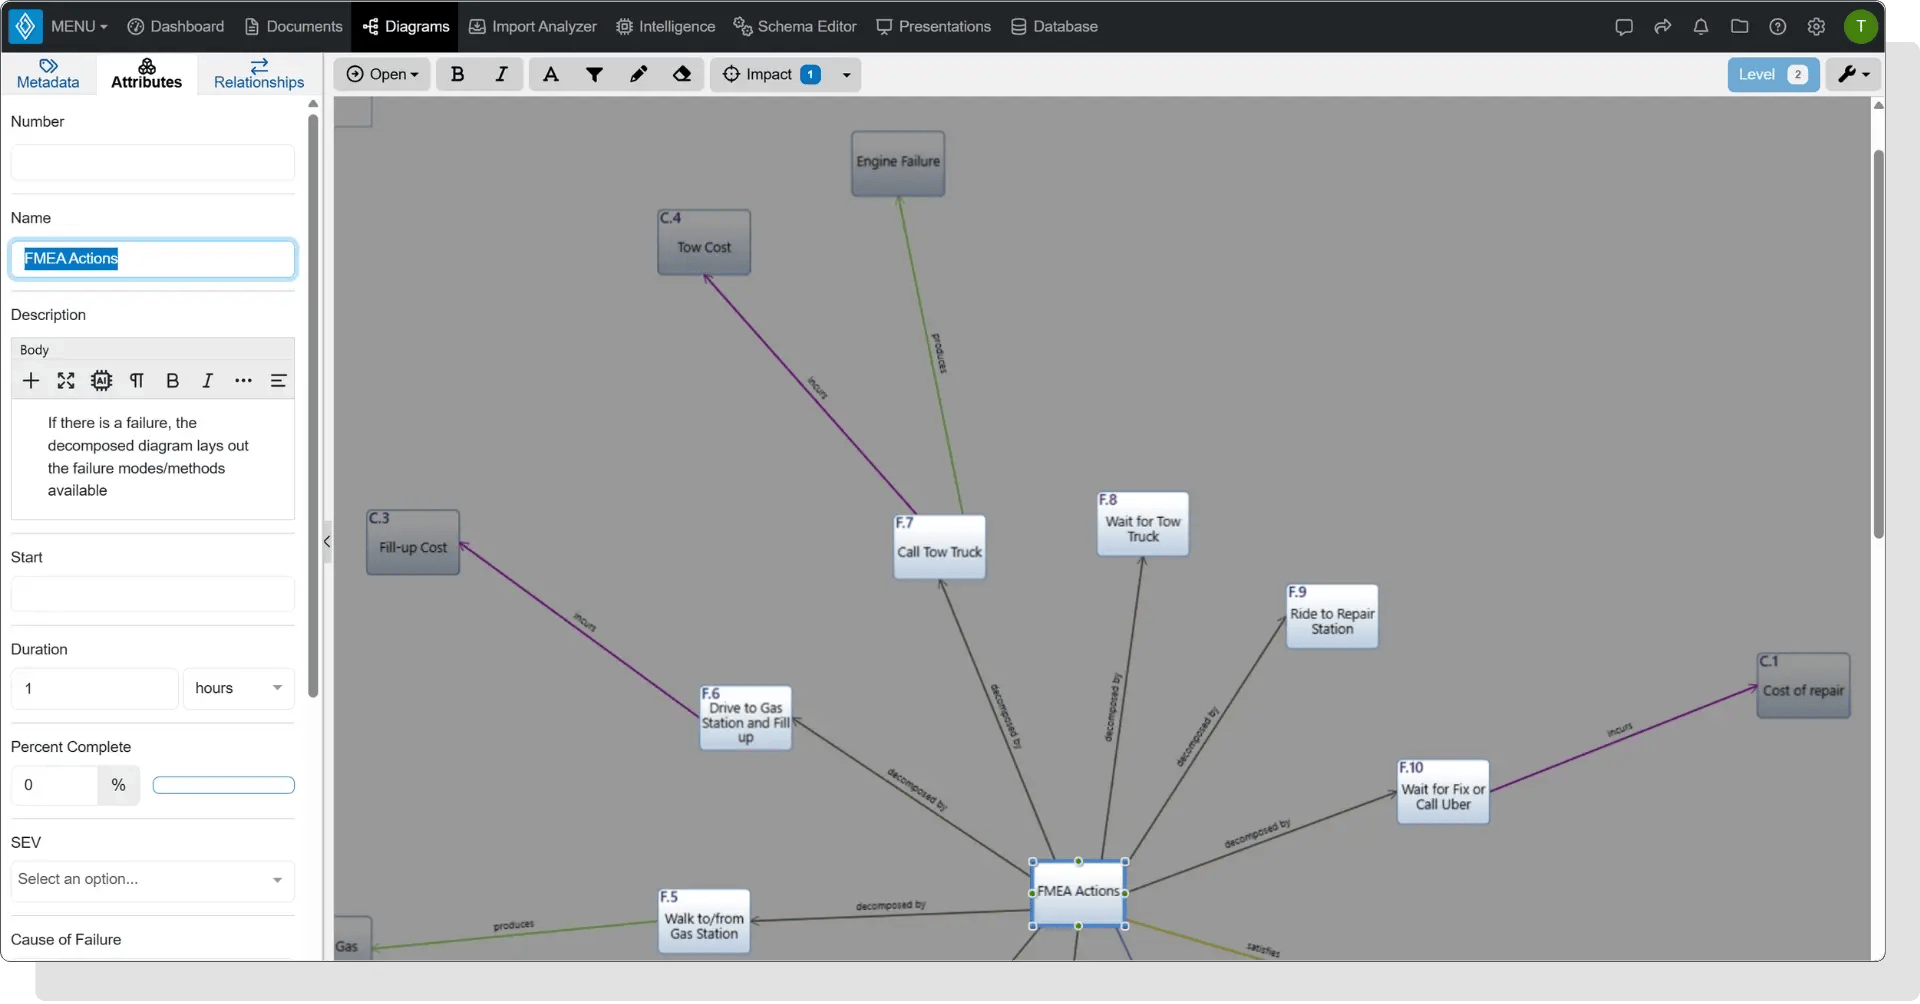
Effects can also propagate beyond the immediate component or function. In a complex engineered system, a single failure could affect other components, requirements, system functions, mission objectives, cost, schedule, safety, or performance.
This is also where end-to-end traceability becomes valuable. Connecting a failure to the engineering data it affects can help teams understand how a change or problem in one area may propagate throughout the system.
📖 Related Reading: Using Impact Analysis to Align Teams in MBSE
Step 4: Identify the cause and response
Once the team understands what can fail and what the effects could be, there are two important questions to consider: Why could this failure happen? And what happens if it does?
Potential causes help teams understand why a failure might occur and where preventative actions could be applied. Depending on the system, these causes might include component degradation, environmental conditions, incorrect operation, manufacturing defects, insufficient maintenance, or design limitations.
The team can then identify controls, responses, or mitigation actions for each failure. The Innoslate vehicle example includes a defined response for each scenario.
Flat tire
When a flat tire occurs, the model performs a Change Tire action before returning the vehicle to normal operation.
The action includes:
Out of gas
Running out of gas requires multiple actions:
-
Walk to and from a gas station to obtain a few gallons of fuel.
-
Drive to the gas station and fill the vehicle.
-
Return to normal operation.
The model accounts for the time associated with these activities as well as a $50 fuel cost.
Engine failure
Engine failure requires a more extensive response:
-
Call a tow truck.
-
Wait for the tow truck.
-
Ride to the repair station.
-
Wait for the vehicle to be repaired or use an alternative form of transportation.
-
Return to normal operation.
The model incorporates both the time required for these activities and associated costs, including towing and engine repair.
These responses demonstrate an important part of how to do a FMEA: identifying a failure isn't enough. The analysis should ultimately help engineers determine how the risk can be prevented, detected, controlled, or mitigated.
✏️ Note: We include cost in this analysis, since that usually provides critical information for trade-offs between alternatives.
Step 5: Evaluate and prioritize risk
Once teams have identified potential failure modes, they need a way to determine which ones require the most attention. Traditional FMEA commonly considers three factors:
-
Severity: How serious would the consequences be?
-
Occurrence: How likely is the failure or its cause to occur?
-
Detection: How likely are existing controls to detect the problem before its effect occurs?
Together, these factors create a more structured FMEA risk assessment, allowing teams to compare potential failures and prioritize mitigation efforts.
A traditional method of combining these ratings is the Risk Priority Number (RPN):
RPN = Severity × Occurrence × Detection
For example, a failure with a severity rating of 8, occurrence rating of 4, and detection rating of 5 would have an RPN of: 8 × 4 × 5 = 160
RPN can help teams compare failure modes, but it should not be the only consideration when making risk decisions. A highly severe failure, for example, may still warrant action even if its overall RPN is not among the highest.
The vehicle example illustrates why looking at multiple characteristics matters. A flat tire is the most frequent failure mode in the example. An engine failure, however, involves towing, repairs, longer delays, and potentially much greater cost.
Simply asking "Which failure occurs most often?" therefore doesn't provide the entire picture. Engineers need to understand both the likelihood of failure and its potential consequences.
📖 Related Reading: How to Perform Risk Management
Step 6: Model the failure process
A traditional FMEA is often represented as a table. While tables can document failure modes and ratings effectively, model-based engineering can provide additional context by showing how a failure interacts with the system.
In Innoslate, the vehicle FMEA is represented as an executable process model. The initial Action Diagram represents vehicle operation and determines whether a failure occurs. The decomposed FMEA Actions diagram then shows what happens for each specific failure mode.
This allows engineers to visualize:

More importantly, the model can incorporate quantitative information. For example, the vehicle FMEA includes:
-
Failure probabilities
-
Activity durations
-
Repair times
-
Replacement costs
-
Towing costs
-
Fuel costs
Once this information is incorporated into the system model, engineers can go beyond documenting possible failures and begin evaluating their potential impact.
Step 7: Simulate the effects of failure
One advantage of conducting FMEA in a model-based environment is the ability to use modeling and simulation to explore how different failure scenarios could affect the system.
Innoslate's vehicle example uses both Discrete Event Simulation (DES) and Monte Carlo Simulation (MCS).
Discrete event simulation
Discrete event simulation evaluates the sequence and timing of events within the model.
For FMEA, this can help engineers understand how failures and their corresponding responses affect factors such as cost, time, resource utilization, and operational processes.
When the vehicle model is simulated, the results provide insight into how the different failures contribute to cost and resource usage over time.
For example, flat tires represent frequent resource usage, while activities associated with engine failure, including towing and waiting for repairs or using alternative transportation, can create notable costs.
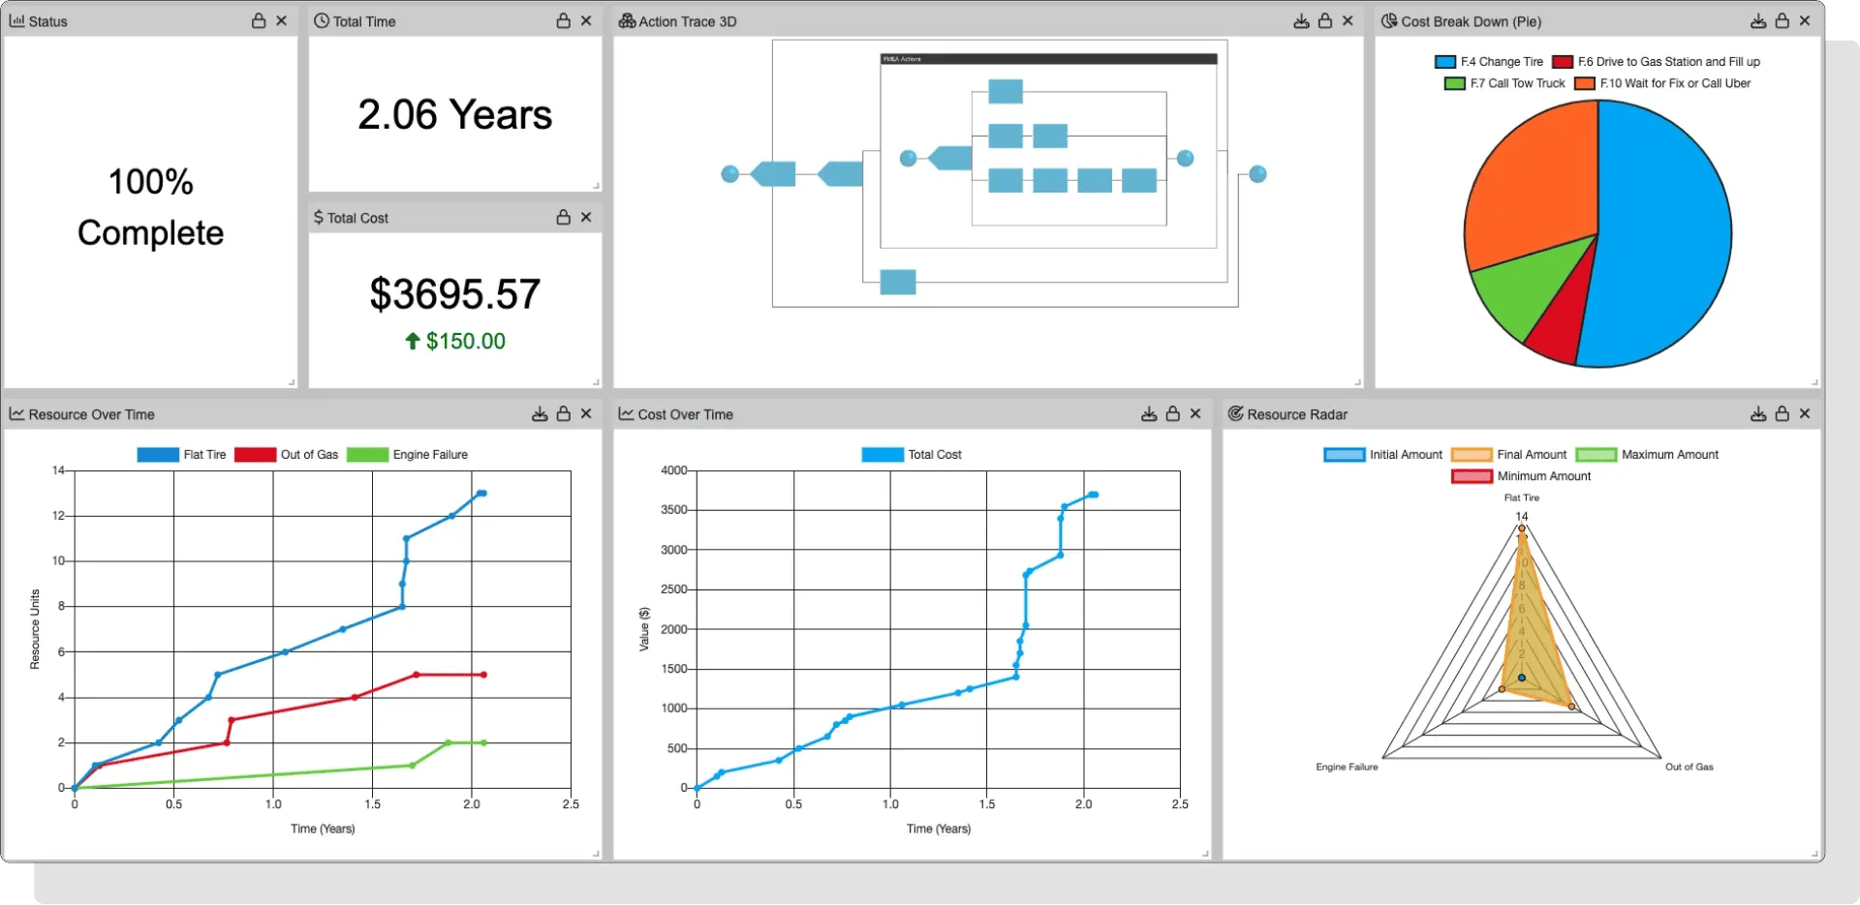
Instead of simply identifying that a flat tire or engine failure *could* happen, simulation helps quantify how those events could affect the modeled system.
Monte Carlo simulation
Failures also involve uncertainty. A repair may take longer than expected. Costs may vary. A particular failure may occur more or less frequently than anticipated.
Monte Carlo Simulation uses repeated random sampling to evaluate this variability across many possible scenarios.
In the Innoslate vehicle example, Monte Carlo Simulation evaluates the range of possible costs and durations associated with the modeled failure scenarios.
The results show distributions rather than relying on a single deterministic outcome, giving engineers a better understanding of the range of possible impacts.
.webp?width=910&height=444&name=Innoslate%20Vehicle%20FMEA%20Monte%20Carlo%20Simulation%20(1).webp)
This can help answer questions such as:
-
What costs are we most likely to experience?
-
How much could those costs vary?
-
Which activities are the largest cost drivers?
-
Which failures create the greatest schedule impact?
-
What happens under less likely but more expensive scenarios?
For complex engineering programs, this additional information can support more informed risk and mitigation decisions.
📖 Related Reading: The Difference Between Discrete Event and Monte Carlo Simulators
Step 8: Take action and update the FMEA
The purpose of FMEA isn't simply to produce an analysis. The findings should inform engineering decisions. After evaluating the failure modes, teams can determine where changes or mitigations could reduce risk.
For the vehicle example, that might mean considering preventative maintenance, improving monitoring, carrying a spare tire, evaluating engine reliability, or implementing other measures based on the risks identified through the analysis.
After actions are taken, the FMEA should be reevaluated. Ask:
-
Did the action reduce the likelihood of failure?
-
Did it reduce the severity of the effect?
-
Did it improve detection?
-
Did it introduce a new failure mode?
-
Has the system changed in a way that affects the analysis?
FMEA should therefore be treated as a living part of the engineering process rather than a document that is completed once and forgotten.
What this FMEA example shows
Our vehicle example is intentionally straightforward, but the same FMEA steps can be applied to much more complex engineered systems.
We started with vehicle operation and identified three possible failure modes:

The important takeaway isn't whether a flat tire costs more or less than an engine failure. It's that FMEA provides a systematic way to connect a potential failure with what causes it, what it affects, how significant the consequences could be, and what should be done about it.
A model-based approach can extend that analysis further by connecting failure information to the system itself and evaluating potential outcomes through simulation.
Teams that need to extend failure analysis to consider criticality can also explore how to perform Failure Modes, Effects, and Criticality Analysis (FMECA) in Innoslate.
How to conduct a FMEA in Innoslate
Innoslate allows teams to incorporate Failure Mode and Effects Analysis into the same model-based environment used for systems engineering, requirements management, risk analysis, and modeling and simulation.
Using Innoslate, engineering teams can:
-
Model failure processes visually
-
Define different failure modes and their probabilities
-
Connect failures with response activities
-
Incorporate cost and duration into the model
-
Evaluate severity, occurrence, and detectability
-
Calculate Risk Priority Numbers
-
Run Discrete Event and Monte Carlo simulations
-
Analyze potential cost, schedule, and performance impacts
-
Maintain failure information alongside the broader engineering model
This is particularly useful for complex systems where a failure may affect more than one isolated component. Instead of keeping FMEA disconnected from the engineering data it depends on, a model-based approach can help teams establish relationships across:
.webp?width=2550&height=462&name=FMEA%20in%20systems%20engineering%20(1).webp)
Maintaining these relationships can provide greater visibility into how failures affect the system and help teams evaluate the downstream impact when engineering data changes.
Try the vehicle FMEA example yourself
Want to follow along with this FMEA example? Explore the Innoslate Failure Modes & Effects Analysis (FMEA) Walkthrough for a closer look at the vehicle model, failure processes, and simulation results.
You can also download the example FMEA Project .INNO file from the walkthrough and import it into an Innoslate project to explore how failure modes, responses, costs, durations, and simulations are modeled.
Put FMEA into practice in Innoslate
Knowing how to conduct a FMEA is ultimately about more than completing a table. The goal is to understand potential failures early enough to make better engineering decisions.
By bringing FMEA into a model-based engineering environment, teams can connect potential failures to system behavior, evaluate their effects, simulate possible outcomes, and maintain failure analysis alongside the engineering data it depends on.
Ready to put FMEA into practice?
Model failure scenarios, evaluate their effects, and connect risk analysis to the rest of your engineering data with Innoslate. Create your Free Forever Sandbox.

%20(200%20%C3%97%20100%20px)%20(800%20%C3%97%20400%20px)%20(4).png)
.svg) Steven Dam : 6/9/22, 2:35 PM
Steven Dam : 6/9/22, 2:35 PM

.svg)